Is the message getting through

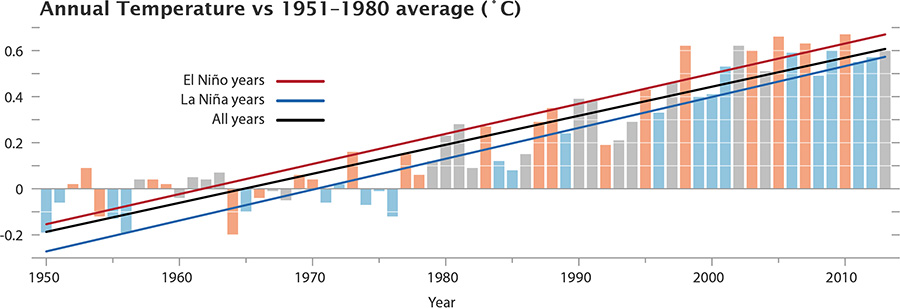
About two years ago John Nielsen Gammon pointed out that if you separately plot global temperature anomalies for El Nino, Neutral and La Nina conditions the increase is roughly the same in each and the linear trends continue. For all Eli knows John was or was not the first to point this out, but it fairly screams at you when you plot the data

Stefan also had made an earlier prediction when discussing ocean heating and its role in a slowdown of atmospheric warming
The next El Niño event (whenever it comes – that is a stochastic process);is likely to produce a new global mean temperature record (as happened in 2010).Eli being a very old Rabett, was sitting in the waiting room at the physician's office (Mom Rabett pointed out one's social life becomes such in old age) reading Time Magazine (where else does a bunny read Time Magazine) and found an article by Bryan Walsh (pay wall) who evidently reads Real Climate saying
... the chances are good that 2014 will be even hotter, perhaps the hottest year since records have been kept. That's because scientists are predicting 2014 will be an El Nino year.A bit ahead of the game, the National Weather Center consensus forecast is
The majority of models predict that ENSO-neutral (Niño-3.4 index between -0.5oC and 0.5oC) will persist into the Northern Hemisphere summer 2014 (Fig. 6). While current forecast probabilities are still greatest for ENSO-neutral during summer, there is an increasing chance for the development of El Niño. The consensus forecast is for ENSO-neutral to continue into the Northern Hemisphere summer 2014 (see CPC/IRI consensus forecast).Clear if you look at how the things have been changing,
Chances are an El Nino in 2014 won't lead to guillotinings in the streets of Paris, but it would cause hotter weather globally. The three warmest years on record, 1998, 2005 and 2010 were all El Nino years. In fact 2013 was unusual because it was so hot despite the fact that there was no El Nino - a sign of just how much global warming has increased. Should the southern Pacific heat up enough for climatologists to declare and El Nino in effect - and that requires three months of ocean temperatures at least 0.9 F higher than average - expect 2014 to be a record breaker on many fronts.


25 comments:
My prediction: if the temperature increases strongly in 2014, the climate ostriches will claim it is due to El Nino and not due to CAGW.
Victor, I suspect that you'll be proven right. Of course, you are referring to people who think that the escalator proves that they're right.
Discover the cause of the warming, the end of it, and why temperatures are headed down.
Two primary drivers of average global temperatures explain the reported up and down measurements since before 1900 with 90% accuracy and provide credible estimates back to the low temperatures of the Little Ice Age (1610).
CO2 change is NOT one of the drivers.
The drivers are given at http://agwunveiled.blogspot.com/ which includes eye opening graphs and a plethora of links and sub-links to credible data sources.
Dan, that's a poe, right?
Thomas, no, I think it's serious. I've run into Dan before somewhere, I just can't remember where.
Maybe on Real climate?
Dan's schtick is turning his inability to properly understand the physics of greenhouse warming or do a proper regression into a disproof of anthropogenic causation.
Actually, Dan, it's the integral of pangolin sightings in the Serpentine over the number of years in the reign of the last King of Greece divided by the number of exoplanets discovered since Fred Singer's last peer reviewed publication.
My prediction from two years ago is posted at Open Mind.
[Recapchta says 'volcano feloogr' - does it know something?]
Russell-- Somehow I was sure it was just mathturbation...
> For all Eli knows
> John was or was not
Yeah, first publication of "prior art" should be acknowledged, at least.
Anon-101a here:
Dan, please explain why CO2 has no effect on the climate and how the Greenhouse effect doesn't work, yet the temperature on the earth is vastly different from that on the Moon (and before you go into "air pressure", please explain why T goes up rather than V goes down, and explain the surface temperature of Titan).
Please explain why the trending has followed the curve expected from the GHG signature has followed that of CO2 concentrations, yet your mechanism is the only one that applies. Please explain why your mechanisms "just happens" to follow the same trajectory required.
The fact that up and down average global temperature does NOT follow the smoothly rising CO2 curve corroborates that CO2 is NOT a driver.
CHANGE to the CO2 level has no SIGNIFICANT effect on average global temperature BECAUSE of how the so-called greenhouse effect works. It appears that you believe that ghg absorb EMR (but apparently do not understand that some (about 12%) of the EMR is thermalized and the rest is re-emitted). If you could understand the mechanism you would realize that more ghg just makes the absorption take place a bit closer to the EMR emitting surface.
Dear Dan,
you are an idiot.
Nobody but an idiot expects global temperature to smoothly follow the rising CO2 concentration. Nobody but an idiot would deny the actual physics showing how CO2 (and other gases) act as greenhouse forcing agents. Nobody but an idiot would ignore that emittance of radiation occurs both up and downwards from the surface of the earth.
And so on.
The fact that up and down average global temperature does not follow the smoothly rising CO2 curve simply means that internal natural variability can temporarily exceed the continuous rising greenhouse forcing, alternately pushing mean temperature both above and below the trend line.
Dan, if you understood the greenhouse mechanism you would realize that it is not the altitude of the lowest absorption/emission that matters, but the altitude of the highest absorption/emission. Adding more ghg makes the altitude of effective emission to space a bit higher, where it is a bit colder, meaning less total energy will be emitted than before. In fact, you would realize that without this temperature differential there would be no greenhouse effect at all.
DENIER DAN (all caps PROVES he is):
"The fact that up and down average global temperature does NOT follow the smoothly rising CO2 curve corroborates that CO2 is NOT a driver."
No, it proves something everyone has known almost forever:
CO2 isn't the *only* driver of climate, it is one of many forcings that drive climate.
D'oh.
Guth, ex, dho – Take the blinders off and look at the link. R2 > 0.9 since before 1900 with no influence from CO2 whatsoever. No-one else has done anywhere near that well.
"since before 1900"
Meaning since before CO2 stood at ~295 ppm, scarcely 15 ppm above the preindustrial level.
Meaning since before over 95% of all anthropogenic CO2 had been emitted.
You actually expected to even detect a CO2 forcing at that level?
Get real and tell me, what is your R2 value for solar for 1960 to 2014?
You actually expected to even detect a CO2 forcing at that level?
Get real and tell me
GIBES
> smooth
Just like the fact that your automobile does not follow a precisely curving path reflecting your steering input proves that you are not a driver. Because there are no potholes and bumps in the road that add their effects changing exactly where the car goes.
ex, Md, Hank - You apparently don't understand what coefficient of determination (R2) means either.
Dan,
No, they do understand. Do you? Do you understand that physics matters? For instance, do you realize you need to regress temperatures against ln(CO2).
Here's someone who did it correctly:
http://bartonpaullevenson.com/Correlation.html
Also, see Foster and Rahmstorf 2011.
Here's where we determine whether your learning curve has a positive slope or not.
It's all explained here: http://greenfyre.wordpress.com/2011/11/13/dans-constant/
And it's hilarious. Really. The last line is a kicker.
a_ray, why bother? It's hard-core maturbation and "cycles" all the way down. Just check his "reference" list.
Dan's not in Kansas any more.
Anon-101a here:
"The fact that up and down average global temperature does NOT follow the smoothly rising CO2 curve corroborates that CO2 is NOT a driver."
Nope, that's as fallacious as correlation proving causation. Lack of correlation isn't lack of causation.
Therefore your claim DOES NOT answer my query. Here it is again:
Dan, please explain why CO2 has no effect on the climate and how the Greenhouse effect doesn't work, yet the temperature on the earth is vastly different from that on the Moon (and before you go into "air pressure", please explain why T goes up rather than V goes down, and explain the surface temperature of Titan).
Please explain why the trending has followed the curve expected from the GHG signature has followed that of CO2 concentrations, yet your mechanism is the only one that applies. Please explain why your mechanisms "just happens" to follow the same trajectory required.
"It's all explained here: http://greenfyre.wordpress.com/2011/11/13/dans-constant/
And it's hilarious. Really. The last line is a kicker."
Snigger.
Post a Comment