Friday, August 31, 2018

The Simplest Green Plate Effect


Sometime ago Eli created a simple example of how the presence of a colder body can limit the rate at which a warmer one emits energy.  If the warmer body is receiving energy at a constant rate, then the steady state (colliquially equilibrium) temperature of the warmer body will be higher.

Of course this kind of kicks in the nuts arguments about how Uncle Clausius Bunny (he was a Bunny, not a Rabett) said that it was unpossible, even though he said no such thing and was quite aware that warmer and colder objects interchange thermal energy, aka heat, just that more flows from the hotter to the colder so on net, the warmer heats the colder.

Following Izen's lead and a suggestion by Christian Anders, Eli has a stripped down version to break even more heads.


Let's start with a blue plate special and a heat source which constantly transfers an amount of heat a per unit area to the plate.  To maintain a constant temperature the plate then radiates an amount of heat b from each side (yeah, Eli is assuming an really large blue plate, but edge effects are a bitch and if the plate is big enough the heat transfer from the edges can be neglected).  The algebra is trivial and the result is that the blue plate sheds an equal amount of heat in either direction


Now let us insert a green plate behind the blue plate.  Working the example through the bunny at the back of the class with his hand up finds that more of the absorbed heat a is radiated from the blue plate b'=2/3a and c=1/3a since a has to equal b'+c


Eli can keep on adding plates, Ms. Rabett has gone out to buy some extras.  Here is the red plate special.  If somebunny works it through they will find that b'=3/4 a, go another plate and, as Christian pointed out, now b' has increased to 4/5 a and so on. 

Eli has not said anything about how the heat is being transferred, radiation, convection or conduction but since heat transfer, no matter the mechanism, is always proportional to temperature, the temperature of the blue plate must increase as more plates are added.

Monday, August 20, 2018

Temperature Correlation Scale Over Time and Distance


What makes global temperature anomalies plots and maps go is the correlation of temperatures over a large area.  This also is key to homogenization of individual station data when something like position or time of day when measurements are made changes.  ATTP has a discussion going along these lines and perhaps Eli, as a long time observer, can add a bit of history and even some new insights.

The first (as far as Eli and most of the Bunnies know) study to make use of this was the ur-GISSTemp work of Hansen and Lebedeff in 1987 which settled on a correlation distance of ~1000 km, but noting a variation with latitude shown to the left.  The figure can be enlarged by clicking on it.

At middle and high latitudes the correlations approach unity as the station separation becomes small; the correlations fall below 0.5 at a station separation of about 1200 km, on the average. At low latitudes the mean correlation is only 0.5 at small station separation.
that they ascribed to

The distance over which strong correlations are maintained at high latitudes probably reflects the dominance of mixing by large-scale eddies. At low latitudes the most active atmospheric dynamical scales are smaller, but apparently there are also substantial coherent temperature variations on very large scales (for example, due to the quasi-biennial oscillation, Southern Oscillation, and E1 Nifio phenomena), which account for the slight tendency toward positive correlations at large station separations.

Casper, Alexander and Vose advanced the climateball in 2006, but to some, maybe only in Eli view not enough, notice, measuring how the correlation depended on season as well as latitude, clearly showing that the correlation distance decreases well below 1000 km during the summer and increases well above it in the winter.

While using a variable correlation distance would be hard to implement with a pad of paper and a comptometer for multiplication and division, it should be easy to do today with significantly greater computer power and better organized data bases to improve homogenization algorithms and temperature anomaly maps.

Which brings Rabett Run to the next point, how many stations are needed.  Sticking to his upbringing, Eli will ask needed for what? If all a lagomorph needs is a global temperature anomaly plot, the answer is not too many and one of the locals, Caerbannog, owns that franchise with his Wattsbuster, which he has been using on and off Twitter to slice dice and rice all use raw station data, use rural station data, use less station data, use more station data, use data from stations with left handed thermometer readers or right. bleats.


You can even get a reasonable match to the various global temperature anomaly measurements with fewer, even less that 10, but what you can't get are maps of the anomalies.  How many do you need for that.

While looking for the Casper, Alexander and Vose paper the existance of which Eli had dredged out of memory, Bunny came across Bridget Tobin's Master''s Thesis (advisor:Jerry North) which makes the point that

The autocorrelation length scale found in annual averaged observational surface temperature data is about 1500km (Hansen and Lebedeff, 1987; Kim and North, 1991). 1500km is the inherent length scale for long term averages in noise-forced energy balance models (North, 1982). It also happens to be the characteristic size for the synoptic scale features that are prominent on daily weather maps. This latter is probably due to the corresponding size of the Rossby radius of deformation (Hess, 1959). The climate (time averaged data) length scale is not solely determined by dynamical considerations but seems to be dependent on radiation damping as well.

It is interesting to see if this is a property exclusively of the surface temperature. If one takes disks of 1500 km radius and covers the earth, about 65 are required. This implies there are about 65 statistically independent regions on the earth with respect to low frequency surface temperature fluctuations (Hardin and Upson, 1993). If the correlation lengths are significantly larger in one season than in the other, it may be possible to use fewer than 65 statistically independent regions to cover the earth during that season. At the same time, the correlation areas seem to be largest in the more variable seasons. This coincidence suggests that a compensation occurs making the sampling errors seasonally invariant. 

So the answer is 65 or so.

Saturday, August 18, 2018

Administrivia

Yes, Rabett Run has a full time administrator, but he sleeps a lot being very old.  Thus Eli has removed the comment notification gadget because the spam is getting fierce and it was exceedingly annoying. 

Read the damn topnotch posts and comments.

Reto Knutti on Research in the Era of Fake News


Reto Knutti wrote his experiences of Fake News and how to deal with it for the Schweiz am Wochenende.  It also appeared on the ETH Zurich website.  Since it is in German, Eli thought a translation would be useful.  As a scientist he included a few footnotes.

------------------------------------------------------------------------------------------------------------------

Research in the Era of Fake News

Fake news is everywhere, but climate research is specially targeted.  Reto Knutti on his experience with fake news and slander

Reto Knutti

A Russian website cites me under a picture as saying that mankind has only three quiet years left.  As a climate scientist I supposedly had written a report to this effect that was under lock and key [1].  Or: I was supposed to have said in another report that mushroom spores cause hurricanes, earthquakes and tsunamis [2]. Of course this is all completely made up from the first to the last word.  Still it did not take long for a Russian television station to come calling for an interview.

Communicating climate change is not for the faint of heart:  The range of reactions to my public statements ranges from allegations of fraud, power seeking and greed to hand written “proof”, that claim to show that conservation of energy is really something else than you find in physics books.  I’ve gotten used to this but it’s different when it comes to slander.


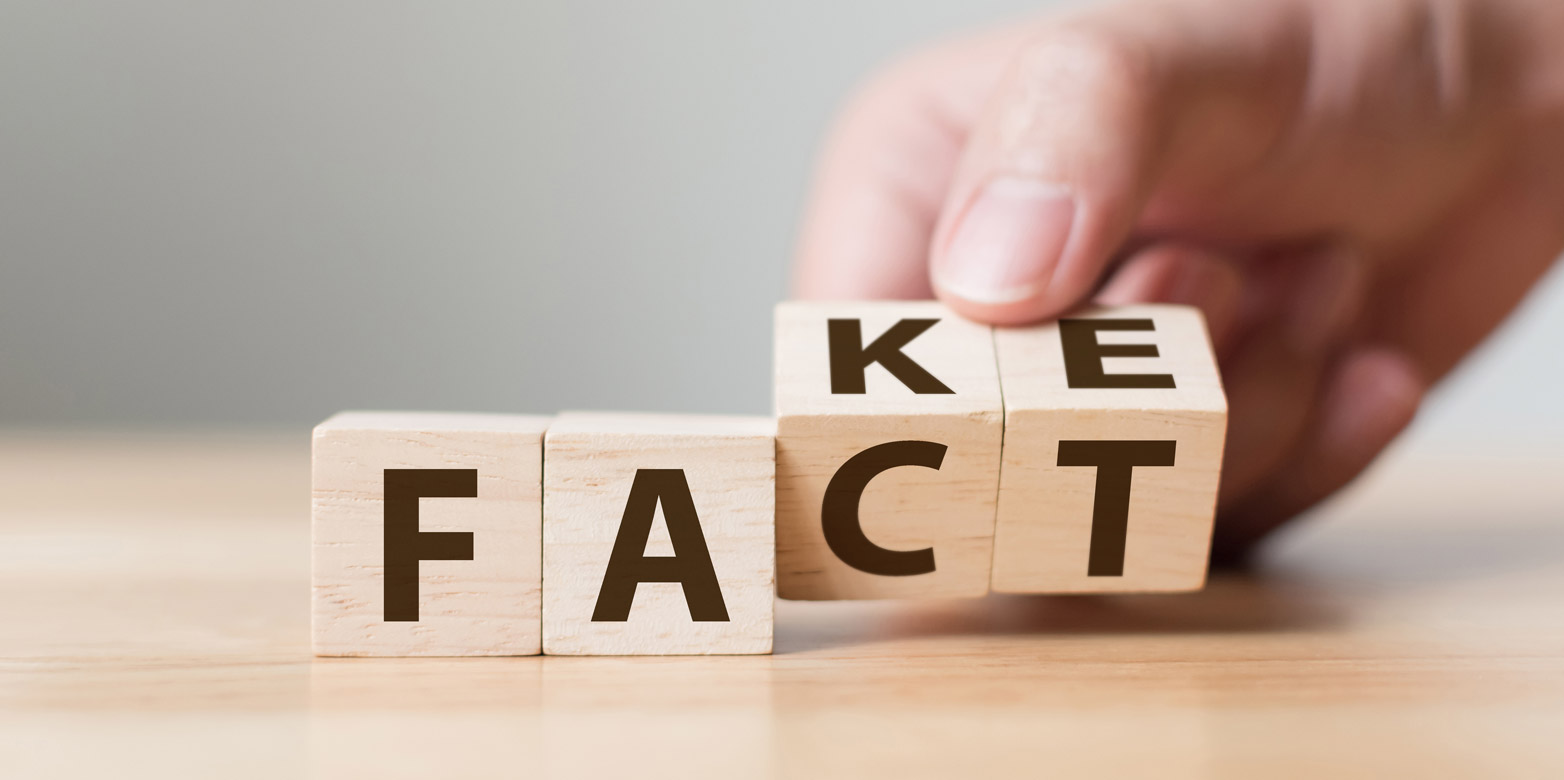
Those who lie about climate change or spread false rumors mostly do that because proposed solutions collide with their personal world view (Picture: marchmelena29 /iStock)

Known Symptons

The problem in a post factual age are at least superficially well known:   Democracy requires an informed public that in spite of differing opinions find common solutions.  But the opening of academic discourse (wissen-ER) through social media has led to each and every being able to say something faster and faster.  Everybody talks, no one listens and experts are often held to be suspicious rather than trustworthy.

In social media we often find ourselves in bubbles, there are no quality controls and fantasies or controversial statements get the most “likes”.  Fake news spread on Twitter faster and wider than facts [3].

There are reasons why the truth does not penetrate.  Sometimes it’s just about paying attention or advertising revenue.  In the case of climate there are often political or economic interests.  In 1998 an internal report from Shell documented the dangers of manmade climate change and the possible effects on the oil industry.  After that for many years the company tried to cast doubt on the scientific consensus [4].

Even today in the US one in four registered voters believes that global warming is fictional [5].  More than anywhere else opinions about climate change are determined by political ideology:  People don’t “believe“ in climate change because the possible solutions (high energy prices, governmental regulations) contradict their personal neoliberal convictions about unlimited growth and small government.

Hand Wringing About Solutions

Much of this diagnosis is not new.  The underlying problems are made worse by the vanishing of quality journalism, shouting on social media and as a result an increasingly polarized society.  How can one best deal with Fake News?

I have no conclusive answer.  Some answers which at least at first view seemed clear (not only to me) simply don’t work.  More facts in even more reports are to be sure relevant for policy decisions and technical solution but they scarcely change the opinions of the already convinced.  On the contrary, making clear why Fake News is fake often only increases its visibility.

Most of my attempts to respond to hostile or random claims and discuss them on line have not been fruitful.  The exchanges give the impression that the situation is unclear and everything is open to debate.  It is astounding that even penetrating the bubble does not help.  People who every day voluntarily confront different perspectives on Twitter become even more convinced in their views [6].

Get Involved Anyhow

There are also bright spots.  New work shows that readers can better deal with fake news if they are warned beforehand that it exists on a topic [7].  I am still convinced that we must continue to think about the relevant questions and discuss them in public despite the abundance of evidence and the shortage of time.

My experience is that eye to eye dialog is best when we are trying to separate facts from opinion.  A thermometer is not politically right or left exactly the same as there are not two sides to gravity.  We can agree about the facts and still have a debate about how we should react to them.  As scientist I don’t dictate to society what should be done.  However, I consider it my duty not only to produce numbers but to look at them critically and to explain what they mean without engaging in PR – a tightrope dance in the age when researchers are fighting for money and positions [8].

In addition to a common (fact based) denominator I always try to find common values and goals in conversations.  For this the way a problem is formulated, so called framing, is extremely important.  Respect for other opinions and readiness to listen are elements that build the trust that helps build bridges.  In this stories are crucial to deliver the message.  It all takes time but for me there is no way around it.

Sometimes It Needs a Few More Characters

Controversy delivers good headlines buy hardly constructive discussions.  With all the enthusiasm for new media and big data, for me, a real discussion requires both the solid synthesis of a quality newspaper and an informed reader rather than propaganda tweets from Trolls on the Web.  Not to mention algorithms that daily determine what is true or false.  Jack Dorsey, co-founder of Twitter, once said: “One can change the world with 140 characters”  He is really right.  But to understand the world and to improve it for the next generation you need a few more.

References

1. The ETH deliberately is not linking to these pages.  A Google search “knutti "the impending weather and climate catastrophe" will find multiple examples

2. The ETH deliberately is not linking to these pages.  A Google search “knutti Monica Gagliano" will find it

3. Article in Science

4. Center for international and environmental law: Internal Documents Shed New Light on Shell’s Role in the Climate Crisis (April 2018)

5. Yale Program on Climate Change Communication: Politics & Global Warming (March 2018)

6. Article in the Tagesanzeiger based on a preprint of a scientific manuscript

7. PNAS: Science in the age of selfies

Sunday, August 05, 2018

Interesting Times in the Arctic


Well, after what has been a boring melt season, maybe even Neven thinks so, the Northern Hemisphere heat wave appears to have created some interesting times (in the sense of the Chinese curse, may you live in interesting times) at the end. 

It may in the long run be nothing, but the ice pack appears to have separated from Greenland and the passage between Ellesmere Island and Greenland, or at least some impressive melt pools have formed and the ice to the west of the separation is not healthy


EH2R has a nasty gif  showing this from NASA Worldview, again, interesting in the catastrophic sense with a comparison from 2012 where it was smooth enough to skate on (well not really but not nearly so broken up)


Zack Labe has a really good tweet about this


And last, but not least, there are, again, interesting things happening on the Pacific side.  Neven has that story.  Basically WTF?


Could be interesting.

Saturday, August 04, 2018

The blind orange squirrel on Trump's scalp finds a nut


I share the same appalled reaction as the rest of the planet to Trump's dimunitive behavior when standing next to Putin. That isn't really what this post is about, but I can't entirely ignore it. I disagree with the claim that he made a Kinsley Gaffe when he said:

...they said they think it’s Russia. I have President Putin; he just said it’s not Russia. I will say this: I don’t see any reason why it would be

A Kinsley Gaffe is when someone publicly says something they privately believe to be true and gets in trouble for it. That didn't happen here - Trump knew he was lying the first time around about there being no reason for Russian interference. He then lied again a few days later by claiming he meant to say he didn't see any reason why it "wouldn't" be Russia - he didn't mean to say that, he's just layering on another lie because he was in trouble from his previous lie. Saying there was literally no valid reason arguing against Russian involvement would be completely inconsistent with virtually everything that comes out of his mouth on the subject, constantly casting doubt on Russian involvement.

And none of that is what I want to talk about - which is the new gas pipeline, and Trump's Blind Squirrel is right to criticize it. However bad and dangerous Russian interference is in American elections, it's even worse in Europe. Why is Germany rewarding Russia when Germany and the rest of the democratic world is under attack?

I get the interdependence idea that Germany has advanced even during the Cold War, but this pipeline has the opposite effect - it reduces interdependence with Eastern European countries that are otherwise under the Russian thumb. Right now, if Russia cuts off supplies to Ukraine or other East European countries it's mad at, then it also loses sales to Western Europe. This new pipeline decreases integration and interdependence.

Trump's goal is for Europe to buy more American natural gas instead. A better goal and an achievable one is to further ramp up European renewables generation and storage capacity. It's not just an environmental issue, it's a national security one. Germany is missing the boat.