
Mr. Coffin, meet Ms. Nail
As the attentive amongst the mice have noticed, Ethon has been guest dining on liver and cheese pudding over at Climate Feedback. There, as others have noticed, Roger took out after the NY Times which attributed changes in growth zones to climate change with illustrative reference to the Atlanta GA area. Roger used this figure from NOAA
Except that if you look at trends from say 1980 to 1990 or 1990 to 2007 in the southeast US you get a significant warming trend vs a standard 1951-1980 period.which got swallowed up in Olive's weekend fun, but no never mind, Tim Lambert had seen the same thing, and he RTFR, posting the figure immediately to the right of the one Roger had used.
 showing how climate had warmed. In the words of Ike Solem in the comments at CF (to use a Stoatistic description)
What seems to be going on in the above post is that Pielke is choosing a baseline that reduces the trend (i.e. back to 1901) - in other words, as a political strategist, he is following his own advice and choosing the baseline that supports his political goal - which is apparently to get attention as a 'noted climate skeptic'.BTW, the comments, well some of them at Deltoid and CF are particularly worth reading to understand the arguments (and the errors in the original post). Looking up a different issue Eli came across an image which really puts Ike's lesson home. It comes from Global temperature change by Hansen, Sato, Ruedy, Lo, Lea, and Medina-Elizade PNAS September 26, 2006 103 (39) 14288-14293

(Let me know if you cannot see this. It is from the PNAS site and should be open)
Figure A shows the rate at which isotherms (lines of constant temperature) have moved away from the equator (negative numbers correspond to moving towards the equator in km/decade from 1950 to 1995. It appears that there was hardly any change in the SE US, however, if Eli may direct the attention of the mice to Figure B, we see that the change has been 30-60 km/decade in the period 1975-2005. Hansen, et al point out that
A study of 1,700 biological species (36) found poleward migration of 6 km per decade and vertical migration in alpine regions of 6 m per decade in the second half of the 20th century, within a factor of two of the average poleward migration rate of surface isotherms (Fig. 6A) during 1950–1995. More rapid warming in 1975–2005 yields an average isotherm migration rate of 40 km per decade in the Northern Hemisphere (Fig. 6B), exceeding known paleoclimate rates of change. Some species are less mobile than others, and ecosystems involve interactions among species, so such rates of climate change, along with habitat loss and fragmentation, new invasive species, and other stresses are expected to have severe impact on species survival (37).Figures C and D are for a business as usual situation (BAU in Stoatspeak) and for a proposed alternative scenario. As can be seen below, the northward shift at the northern edge of growth zone 8 encompassing Georgia was a bit less than 2 degrees latitude (Georgia is about 4 degrees latitude from north to south). Of course, growth zones correspond to minimum winter temperatures, a climate parameter of great interest to growers and NOT what Ethon's friend wrote in Climate Feedback
In most places the range of increased average minimum temperature has moved north as can be seen from a difference map between the two time periods.The sources that Roger Pielke Jr. points to to buttress his claims, of course, refer to average minimum and maximum temperatures, an irrelevant thing. To finish this off, let us actually LATFM from the Arbor Day Foundation which shows the changes.
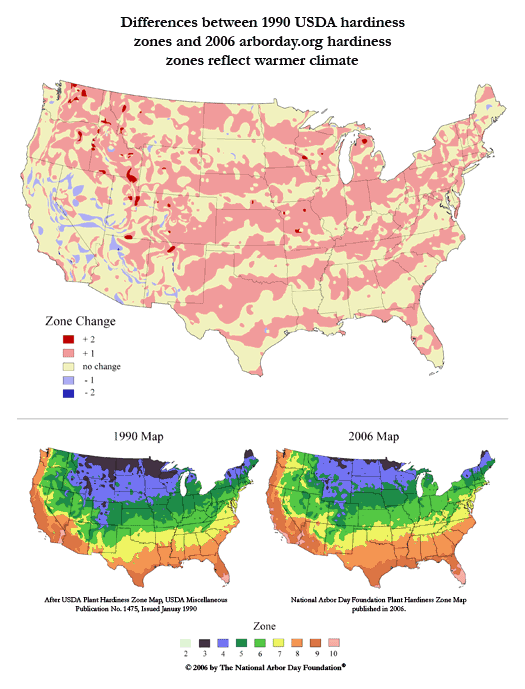 (BTW there is a great interactive version of the 1990 map at the National Arboretum, perhaps the best museum in Washington DC. Not to be missed by all who favor botanizing and munching on the grass)


7 comments:
There is no map in the IPCC report that shows the minimum winter temp, but the IPCC does make this general comment:
"daily minimum
temperature increased in most areas except western Australia and southern Argentina, and parts of the western Pacific Ocean; and daily maximum temperature" (from the period 1979-2005)
Also, there is a map in Fig 3.10 -- the figure immediately following the one that RP picked his map from -- that shows something that is much more relevant than the annual average that is shown in the map that RP used to argue his point.
That is the map for the seasonal temp trend from 1979-2005 for the winter months (DJF), which shows warming over the entire US, including the SE US that Pielke had circled and labeled cooling on the map that he showed.
One would really have to be an idiot to look at these maps and fail to appreciate that there is a pretty clear warming trend that is happening throughout most of the world.
I suspect that the warming trend in Greenland over the 1979-2005 period may be more significant than the warming in the US -- and not because of plant hardiness issues (though Greenland may start to look more like it's name)
I know how fond you are of the word, Eli, so I move that the notation on the now world renowned "Pielke Circle" be changed from "Cooling! to "Cool-aide!".
Following Rabett's Rules of Order, I believe that we need a second on that motion from among the anonymice.
...but a third from the mice, will also suffice and is thrice as nice.
That's true, 2nd mouse, but don't forget the intervening Slushland stage. And of course when it's all over it'll be Greenlands (or perhaps Green Archipelago would be better). I prefer to look at this outcome not so much as a global environmental catastrophe as an opportunity for real estate fraud undreamed of by Leif E.
Maybe if his book bombs, RP could open a chain of restaurants with the name "Pielke Circle".
Re: RPJ as skeptic
If that is his goal, he has a strange way of showing it.
Post a Comment