Monday, August 14, 2023

Don't trifle with judges, Montana edition

My direct and indirect experience with trial court judges is that they are mini-dictators/monarchs in their courtrooms, and that's probably a good thing. Unlike the vast majority of real dictators, they can be benevolent, but even if that's not their default personality, you still want someone who will occasionally stand up against powerful individuals, organizations, and the government itself. Trifle with them and find out what happens.

So we have a Montana trial court issuing today an opinion in favor of youth plaintiffs, saying Montana's law forbidding consideration of climate change impacts violates Montana's constitution requiring environmental protection. The kicker is that the state defendant spent all of one day in court presenting its side, after months of evidentiary proceedings.

I'm sad to say I don't know Montana law specifically and look forward to reviews by state experts. I am reading the opinion though and thought I'd throw out a few thoughts:

*fundamentally this is about resolving a legal conflict between a state statute saying 'ignore climate change' and the state constitution saying the state shall "maintain and improve a clean and healthful environment in Montana for present and future generations." Its direct relevance to other states requires a similar conflict. Indirectly, from a legal realism perspective, it might have more effect on nudging judges to take climate change seriously.

*lots of evidentiary battles in pretrial activity followed by only one day of testimony by the state in defense (plaintiffs had to have some serious financial resources to do this, btw). I'd love to be a fly on the wall at the state to understand the internal decision-making on that tactic. It feels like a political decision that's pretty close to a forfeit, and I doubt it went over well with the judge.

*the factual findings may be more important than they first appear, basically reiterating well-known facts about climate change and the harm it has on the environment and people. That might sound like non-news, but barring reversal on appeal - and appeals very rarely reverse factual findings - those findings become the "law of the case" requiring Montana for purposes of the case to acknowledge climate change is real, anthropogenic, and harmful.

*the concept of collateral estoppel/issue preclusion might also apply, and this is where a Montana legal expert would be helpful. That legal principle says once an issue has been litigated, it's done, and the party that lost can't try it again in a different proceeding. In other words, Montana could be stopped from denying climate reality not just in this case but in any other case (barring new evidence, which probably would have to overcome a significant legal hurdle to reopen the issue).

*I'm curious how easy it is to amend the Montana constitution. I expect we'll find out.

*the procedural stuff at the end saying the statute is subject to strict scrutiny etc. is the hardest to assess, but it's key to whether the case becomes a footnote or whether it has actual legal teeth in Montana.

Some other stuff:

*Svante is in the findings! Paragraph 74 - gotta love that, helping laying down the marker that CO2's role is well-understood and only became politicized by denialists, when the truth became inconvenient. Keeling Curve is there as well.

*because the plaintiffs claimed mental health damage from climate change's impacts, Montana demanded the right to conduct adversarial mental health examinations of these under-age minors (page 5). The judge told the state to take a hike. In circumstances where you're trying to assess damages, an examination is reasonable, but here it really isn't. The state is acting like a jerk, and I doubt it helped with the judge.

*findings about the under-age plaintiffs make them very appealing, what lawyers call "good facts" that hopefully make the court want to find ways to support your side. If they're willing and capable, I think these kids could be good media emissaries.

*twice the state tried to get Montana's state Supreme Court take the case away from the trial court, and the Supreme Court refused. Something else that is likely to have annoyed the judge.

*Glacier National Park, unsurprisingly, played a major role in the opinion. Glad to see it, and I did a volunteer vacation for glacier monitoring and blogged about it, way back when.

*plaintiffs are getting attorney fees and costs, which sounds administrative but is going to be a lot of money and is vital to the future success of cases like this. I suppose that could be reversed though if the case gets reversed on appeal.

Tuesday, June 20, 2023

Which Came First or Beyond Correlation

An evergreen (you know CO2 makes for more plant growth) of the denial industry is that "you can't show that CO2 CAUSES Climate change". Let Eli fish a few of these poggies out of his Twitter bag

and another

But it, of course not, is not just the CO2 has no effect on climate, but the anti-vaxxers and any other delusions of the denial crowd declaring that correlation is not causation. Well, as Eli has been rumored to reply, it can be a pretty strong hint if you understand the mechanism. To be honest, Eli is not very comfortable with any claim that correlation is causation lacking a mechanism, it's the physicist in the Bunny but there is a reason physicists are rare.

Properly speaking this is more a question for Tamino but Eli was trolling the web when up popped the answer Stips, A., Macias, D., Coughlan, C. . On the causal structure between CO2 and global temperature. Sci Rep 6, 21691 (2016) [OPEN].  The abstract says it all
We use a newly developed technique that is based on the information flow concept to investigate the causal structure between the global radiative forcing and the annual global mean surface temperature anomalies (GMTA) since 1850. Our study unambiguously shows one-way causality between the total Greenhouse Gases and GMTA. Specifically, it is confirmed that the former, especially CO2, are the main causal drivers of the recent warming. A significant but smaller information flow comes from aerosol direct and indirect forcing and on short time periods, volcanic forcings. In contrast the causality contribution from natural forcings (solar irradiance and volcanic forcing) to the long term trend is not significant. The spatial explicit analysis reveals that the anthropogenic forcing fingerprint is significantly regionally varying in both hemispheres. On paleoclimate time scales, however, the cause-effect direction is reversed: temperature changes cause subsequent CO2/CH4 changes.

This is not unexpected, indeed a figure that your friendly correspondent has used frequently to describe cause and effect, drives home this conclusion on physical grounds (Figure 1.1 Feedbacks in the climate system by Kurt Lambeck)


The information flow method was developed by X. San Liang in 2014 [SADLY NOT OPEN] for exactly this kind of situation (there is another method for separating cause and effect called Grainger causality)

Given two time series, can one faithfully tell, in a rigorous and quantitative way, the cause and effect between them? Based on a recently rigorized physical notion, namely, information flow, we solve an inverse problem and give this important and challenging question, which is of interest in a wide variety of disciplines, a positive answer. Here causality is measured by the time rate of information flowing from one series to the other. The resulting formula is tight in form, involving only commonly used statistics, namely, sample covariances; an immediate corollary is that causation implies correlation, but correlation does not imply causation.

More in this paper by Liang [OPEN] for those wanting to dive in but let's look at what Stips, et al, find for information flow to global temperature anomaly between 1900 and 2008.

Radiative Forcing

Correlation and Causality–HADCRUT4

Correlation

ForcingGMTA [nat/year]

GMTAForcing [nat/year]

Total forcing

0.804 ± 0

0.244 ± 0.091

0.036 ± 0.080

Anthropogenic

0.863 ± 0

0.355 ± 0.112

−0.008 ± 0.005

All GHG

0.852 ± 0

0.318 ± 0.108

−0.005 ± 0.003

CO2

0.852 ± 0

0.316 ± 0.108

−0.003 ± 0.003

Aerosol

−0.810 ± 0

0.232 ± 0.095

−0.002 ± 0.006

Cloud

−0.796 ± 0

0.208 ± 0.092

−0.001 ± 0.004

Solar

0.616 ± 0

0.082 ± 0.059

0.035 ± 0.051

Volcanic

0.089 ± 0.267

0.003 ± 0.006

−0.004 ± 0.009

AMO (1900–2008)

0.477 ± 0

0.018 ± 0.043

0.021 ± 0.014

PDO (1900–2008)

0.123 ± 0.204

−0.002 ± 0.013

−0.011 ± 0.025


Larger numbers in the middle column show causation larger numbers in the rightmost column label effects of GMTA.  At least for the 1900 - 2008 period the increase in atmospheric CO2 is the largest cause of the GMTA, although aerosols and clouds also are important. The solar is low as are the AMO and PDO, although they both correlate well with GMTA. As the paper puts it
This is a good real world example that illustrates the basic fact: correlation does not mean causation. It further questions the assumed fundamental role of the AMO for the global climate as speculated in38.

 That should make Mike Mann very happy if he has not seen it. 

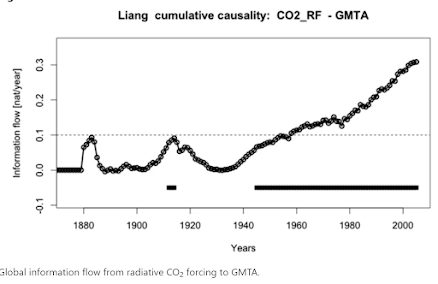
Also interesting is the cumulative causality 

Which implies that GHG warming really only became dominant around 1960 e.g. after 1960, CO2 concentration was even more dominent. If information flow is applied to shorter time periods, then other forcings can be temporarily causitive, such as the period a few years after a large volcanic eruption.

But what about paleoclimate?

By calculating the IF in nat per unit time from the 1000 year interpolated PAT time series to CO2 concentration we get 0.123 ± 0.060 nat/ut and −0.054 ± 0.040 nat/ut in the reverse direction. Therefore we have on these long time scales a significant IF only from the temperature data to the CO2, but not in the other direction, exactly opposite to that seen in the data from the last 156 years. This result proves robust against using different ice age/gas age chronologies (SI, Tables SI-5 and SI-6 comparing EDC3 and AICC2012 chronology) and against using the recent corrected CO2 data from Bereiter45 (SI, Table SI-7).

which is just what Figure 1.1 shows. And what about the future, where will increasing GHG concentrations bite the hardest. Stips, Macias and Coughlan have an idea based on information flow

So the next time you hear correlation doesn't prove causality, point them thisaway or to the Nature Scientific Report article.


Sunday, May 07, 2023

Gasoline consumption, California and USA

California:


I think the moderate drop after 2020, which appears to be continuing when comparing 2022 (so far) to 2021, masks a much larger and continuing drop in the SF Bay Area, a possibly slightly increased drop in the LA area, and significant increases in gas consumption in Central Valley. About 19% of new California vehicles in 2022 were zero emission, almost all of them BEVs. People owning multiple vehicles will preferentially drive BEVs over ICE vehicles because operational costs are lower. The overall vehicle fleet is nowhere near 19% BEV, but in terms of Vehicle Miles Traveled, BEVs will be over-represented.

More gist for my speculation that gas stations will become increasingly hard to find and make ICE vehicles increasingly inconvenient, something that would create a virtuous cycle. We'll see if this dynamic comes into play faster than the effect of California's banning new ICE vehicles in 2035 - I hope so, and in the US it's most likely to occur in the SF Bay Area. 


USA:


Not much of a recent trend, yet, although the slow rise up until 2005 has clearly stopped. Zero emission vehicles were 6% of all sales in 2022 and rising rapidly. I expect we'll see a decrease in a year or two, although that will mas bigger decreases in California and a few other state markets combined with some increases elsewhere. More than a few years out and there should be some big changes.

In a decade (sooner in some places), the effect of gas price shocks on the rest of the economy will be smaller than at any time since the 1950s. It can't come soon enough.