Going Vertical

UPDATE: An English version of Jos Hagelaars Dutch post is now available on Our Changing Climate. Eli appreciates their recognition that this indeed is the Wheelchair Curve
Jos Hagelaars has spliced together Shakun et al, Marcott et al, HadCRUT4 and the A1B scenario
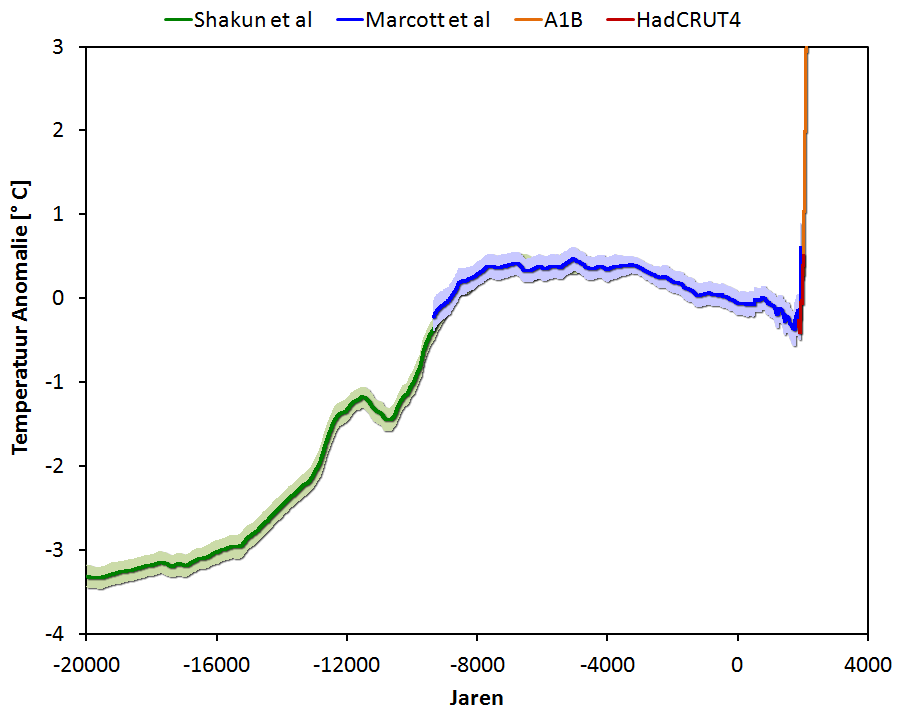
An important point in Marcott is that it pretty well delineates the start of the Anthropocene, about 150 years ago, when we added the blade to the hockey stick
Google does a fair job translating and Eli will not step on Jos and Bart's toes by attempting same (Dutch is close enough to German that Eli can Grok it given incentive)


41 comments:
This is pretty much garbage as subsequent analysis has already shown. Ice core isotope and boreholes do indicate a 2+ degree max at the alti-thermal as we would imagine given all the additional insolation over the NH ( and so disproportionately over land ).
But even if that max were less, it obscures the seasonal significance.
If northern summers were much hotter but winters much colder, the annual average might be zero, but the climate much different.
Glossing over reality is what 'climate analysis' has come to in the race to confirm a bias.
Eunice.
As mentioned on Twitter by Michael Mann: this graph desperately needs a new name - it is no longer a hockeystick.
I rather like: 'The Beach Chair'. A chair with a pretty stiff back, though.
Anonymous,
Ice cores are taken from the top of the Greenland icesheet. They exhibit extreme Arctic Amplification and they are singular proxies - not 73 locations spread over the planet.
"If northern summers were much hotter but winters much colder"
That is the kind of thing you'd notice in the growth of e.g. planktonic foraminifera as well as in alkenones.
There is little a-priori reason anyway to expect such an increase in seasonality - the Holocene Maximum was warmer because of more summer insolation at higher latitudes: spring started earlier. Straightforward astronomy.
If you search Google Images
holocene temperatures
You get the Marcott curve multiple times
I think of it more as a brick wall we've been rushing toward...
Oh boy!
The fact that much of the steep part is in the future, do you think maybe we ought to get up some sort of plan to change it?
How about it, folks? What say you...
bobbrand, it wouldn't be so bad if we could make it recline...
Was it the Shakun study that rised the T(emperature) at the LGM (Last Glacial Maximum)? (was, c.-5 to -6K). OK, the temperature on an ice age does need to be colder than freezing only in the glacier areas so that Shakun number is still pretty acceptable given that there weren't large glaciers all around. Is there a mapp somewhere to show the averages around the world in a world like that?
oh, and to try to find some humor from this, the Anthropocene clearly starts at 3443BC where there is a bump and a subsequent deviation beginning on the date the guys in Greece and Turkey began experimenting on metal alloys.
Oale --- One can make some sort of inference of regional temperatures and precipitation from
LGM vegetation map:
http://www.ncdc.noaa.gov/paleo/pubs/ray2001/ray_adams_2001.pdf
Eunice.
It's quite handy that you predicate the rest of your post with the spoiler in your first sentence.
Thank you.
Now, move aside and play with your dollies, and let the intelligent people do the thinking. There's a good girl.
Bernard J.
(I think, therefore I'm not a robot.
QED)
(Recaptcha says "onatural"?!)
there's of course this interpretation that was mentioned allready by someone (via Peter Sinclair): http://www.skepticalscience.com//pics/skyjumper.jpg
I've been saying for years that's not a 'hockey stick'.
It's a scythe.
Do recall that the "statistical wonderboy" got red noise wrong and then did a 100:1 cherry-pick of the resulting data and both were needed to get the results he claimed.
Hence, either serious incompetence or academic fraud or some of each. The re noise might be incompetence. it's hard to see that for an explicit 100:1 cherry-pick in the R code (I checked).
And meanwhile, I see we once again have multiple anonymous...
talking of McInture this video is informing...
http://www.youtube.com/watch?v=JT2pNg4oxYE
Bernard J - there is absolutely no reason for your misogynistic reply to Eunice. I am appalled that you seem to think women should 'move aside and play with their dollies'. I disagree with Eunice's point of view but her gender has no part in that.
To add to John Mashey's, there is also the accusation by McIntyre that Mann et al. suppressed Pearson r^2 statistics -- which to my knowledge has never been retracted.
This example has the merit of making it clear even to the not so scientifically trained that, if McIntyre knows a lot of statistics, he understands a lot less of it: r^2 is a completely inappropriate statistic for judging the goodness of temperature proxies, as patiently explained in a way that is still a worthwhile read, in Wahl and Ammann.
Bernard J.,
Have to say that I agree with Louise. The fact that Eunice is a tool has nothing to do with her gender, and it certainly doesn't justify promotion of gender stereotypes/roles.
There is no point in alienating 50% of humanity just to dismiss the stupidity of a commenter. Let's go for creative insults rather than the lazy.
Dr. Lumpus Spookytooth, phd.
@eli
that's great that google search gives you the Marcot curve. I guess this is the true difference between 300%ers and skeptics. The fact that temperatures were warmer before mankind just does not compute in Eli's brain. But of course those of us who have followed the game know that this is all part of the reason that the earth's GAT is not compared to CAT because it's higher. And same with average atmospheric co2. Use the running averages, and you destroy Eli's narrative.
Oale - try Google images
ice age globe
John Mashey said...
Do recall that the "statistical wonderboy" got red noise wrong and then did a 100:1 cherry-pick of the resulting data and both were needed to get the results he claimed.
Hence, either serious incompetence or academic fraud or some of each. The re noise might be incompetence. ....
Indeed -- the reason for the long autocorrelation time in Mc's synthetic red noise is that his "red noise" was contaminated with "hockey stick" signal statistics!
If you are going to use real data as a "template" for synthetic noise, you must first remove any signal components from the data before you do so. Mc failed to do this. And yes, I checked by looking at Mc's R code.
In fact, if you take the tree-ring data in question, zero-mean and variance-normalize it, and then just average the tree-ring chronologies together, you will see the underlying hockey-stick pattern. (It's noisy, but it's there).
That slowly-varying "hockey stick" component needs to be subtracted out before you use the tree-ring data as a model for your synthetic noise (a little detail that Mc overlooked).
For this reason alone, Mc's paper should have been retracted.
--caer
EXPOSED: that this screamingly fraudulent article passed peer review in the top journal in the nation and that Mann and Maddow celebrated it so enthusiastically too means your activist work here, back to '05, now represents a textbook example of a cult running itself off a cliff.
http://s17.postimage.org/qhmuyzfin/Shaun_Hockey_Stick.jpg
The game has changed. Climategate was a minor PR coup compared to this since any layperson can fully understand its debunking just by looking at the lack of *any* uptick in the input data.
Instead of doing damage control you are digging in deeper! Wow. Thanks!!!
-=NikFromNYC=-, Ph.D. in carbon chemistry (Columbia/Harvard)
An English translation is in the making...
Bart
Who's applying gender stereotyping here?
Images of "dollies", one or two of which this particular 50+ male had as a child..
I had hours of fun with my dollies. :-)
Cymraeg llygoden
Hello again, Nik. Still using error-filled images, I see.
As I recall from 2011 when you and I tangled at Scholars & Rogues, you were claiming in a similar image ("Thermometers") that the "hockey stick" in the Northern Hemisphere was false based on far too few data points to support that claim. Two thermometers along the Atlantic coast of North America, three thermometers in central Europe, one in England, and one by the Great Lakes is not sufficient spatial coverage to make claims about the temperature of the Middle East, India, China, Japan, Mexico, etc. Your claims were not supportable by your data and yet you have continued to repeat those unsupportable claims even after this was pointed out to you.
Your "Oceans" image showed raw tidal gauge data for certain cities around the world, and you claimed that sea level rise and acceleration are disproved by those few gauges. However, you neglected to do any data analysis, claiming that "eyeballing is very useful when the signal overwhelms the noise since the noise is only monthly and yearly but there is not much noise decadely, which there isn't." You also failed to use the data properly and didn't correct the gauge readings for post-glacial rebound, land build-up due to silt deposition, land elevation changes due seismic events, or subsidence due to ground water pumping or soil compaction, all factors that the PSMSL (your data source) says must be corrected before using the data. Your claims are not supportable by your data and you have continued to repeat them even after this fact was pointed out to you.
(For proof of my own claims, I invite interested readers to follow the entire comment thread here: http://www.scholarsandrogues.com/2011/05/18/milloys-op-ed-riddled-errors/)
Your "Ice" graph above shows that you are continuing to make claims that are not supported by the data and that you feel "eyeballing" data is still a sufficient substitute for actual data analysis. This is an anti-scientific statement.
Last I checked, you haven't retracted you many incorrect claims, Nik, or modified them to accurately represent the caveats in the data you're using. Until you do, your opinions on the subject of hockey sticks and industrial climate disruption in general can and should be dismissed out of hand.
Meh. The paper is pretty clear that the uptick at the end is not reliable.
"there's of course this interpretation that was mentioned allready by someone (via Peter Sinclair): http://www.skepticalscience.com//pics/skyjumper.jpg
"
Expect to see this in the next SPPI report authored by Monckton. After all, that happened with the sea level rise graphic so I expect the same "correction" to be applied eventually.
-WheelsOC
I say call it "Flight of the Bumblebee in the Modern World" -- or just "beesmack" for short.
I thought Nik-the-Liberator-and-let-me-point-out-PhD-just-don't-you-ever-forget-it-from-NYC-(no-less-!) had retired.
11:05, the uptick at the end in Hoelaars graph is not Marcott but instrumental and CMIP5.
Anon@11:18
"I thought Nik-the-Liberator-and-let-me-point-out-PhD-just-don't-you-ever-forget-it-from-NYC-(no-less-!) had retired. "
I believe the term is "gone emeritus".
There is little a-priori reason anyway to expect such an increase in seasonality - the Holocene Maximum was warmer because of more summer insolation at higher latitudes: spring started earlier. Straightforward astronomy.
Anonymous,
of course there is good reason to expect the Altithermal experienced much greater seasonal variation in the NH - winters received much less insolation ( and polar night lasted longer ) and summers received much more insolation ( and summer lasted longer in the lower latitudes ).
Eunice.
If you want to see this shape in other Holocene records, I would recommend sea level - does anyone have a link to an on-line image of that with the recent uptick shown?
Watts is up to something like a dozen posts on this topic - it seems to have hit a sensitive spot!
As to the start of the Anthropogene, it looks like it began 5000-7000 years ago, probably with the initiation of agriculture, as otherwise ongoing cooling akin to that of other interglacials would have led to significant growth in the (now retreating) ice sheets as part of the beginning of a new ice age. (PowerUp - Ice Age Avoided, with penalty of climate change, mass extinctions, etc!)
KR
The uptick in THIS figure is not from Marcott but from the instrumental records and CMIP5. Remember Hogelaars put together Shakun, Marcott, HadCRUT4 and A1B information to make this figure.
Go over to Moyhu.blogspot.com (Nick Stokes) for more on the uptick in Marcott.
Marcott states pretty clearly (bottom of first page, center column) that they did not think that the 20th C results were robust. McI apparently missed that even though Marcott himself pointed it out to him.
Louise (and a-ray...)
"Bernard J - there is absolutely no reason for your misogynistic reply to Eunice. I am appalled that you seem to think women should 'move aside and play with their dollies'. I disagree with Eunice's point of view but her gender has no part in that.
I'm sorry, but the gender stereotype lies with you. My son plays with dolls as much as his sisters, just as they play with his trainsets, and I make no bones about the fact that I encourage each child to play with what they desire. I chose to mention "dollies" simply because that word immediately conjurs an image of small children (of both genders, in my household) at play. Eunice's gender played no part in my comment.
Frankly, I'm not even convinced that "Eunice" is female. If I am make any gender stereotype at all it's that it's rather uncommon for women to be inclined to frequent demonstrations of stupidity on the internet. On this basis alone my coment was made in a gender-neutral context.
In fact, I see no stereotyping here beyond that which you thought I meant, and what you applied to children's play. What I did mean however is that Eunice has a very childish capacity for cognitive processing. And I do not resile from this thinking - Eunice has displayed the same incomplete capacity for logic on multiple occasions. It's a shame that she got first placing on the comments... and hence my inversion of her intended meaning.
I certainly have no thought that women should move aside and let men do the thinking, and I am appalled that apparently my son is not allowed to play with his sisters' dolls.
Bernard J.
Please, in the future, no mansplaining.
@EliRabett said...
"Please, in the future, no mansplaining."
No indeed, please more Mannsplaining though! :)
@Rattus Norvegicus said...
"Marcott states pretty clearly (bottom of first page, center column) that they did not think that the 20th C results were robust. McI apparently missed that even though Marcott himself pointed it out to him."
Yeah true. McIntyre communicated with Marcott and reported back that he said post 1890 is not robust. Now maybe we need Marcott to point this out to Shakun?
I mean that from this quote Shakun to Revkin, in their interview, he seems to want to show a different view of the emphasis here?
"The real interesting thing is when you tack on where we are headed in the 21st century; and you have the last 10,000 years doing this [hand goes down] to today; and then BOOM! [hand goes off top off the screen] Outside the elevator y'know. Up and out!"
BTW @ EliRabett 17/3/13 6:16 PM
When I tried "holocene temperatures" in google image I only saw the splice you have once from Klimaatverandering. Half way down the first full page. I think that Google targets its image search based on past search history.
I don't like Google doing this myself and always try to clear my cache and log out my ID when doing checks like this. Otherwise it's basically hard coding confirmation bias. ;)
This is just McI and chums manufacturing a fake controversy. It is painful, it is infuriating, it is business as usual.
Bart's graph (thank you, Eli) is the thing that should be commanding attention. Not McI and the Watties and the guff and the nonsense.
But as ever, if you shriek loud and long enough, heads turn.
TL, Shakun was doing premature Hogelaars figuring. LOOK AT THE FIGURE. The boom is the instrumental temperatures and the A1B CMIP5 trends not Marcott, not Shakun. The point is that it all fits together.
On holocene temperatures try this for a start.
@TLITB
How does Shakun's comment contradict what Marcott and Shakuns mentioned in their publication? It does not. In the paper it is mentioned:
"Without filling data gaps, our Standard 5×5 reconstruction (Fig. 1A) exhibits 0.6°C greater warming over the past ~60 yr B.P. (1890 to 1950 CE) than our equivalent infilled 5° × 5° area-weighted mean stack (Fig. 1, C and D). However, considering the temporal resolution of our data set and the small number of records that cover this interval (Fig. 1G), this difference is probably not robust."
While Shakun is commenting (during the interview by Revkin) on the future, the projections for the 21st century:
"The real interesting thing is when you tack on where we are headed in the 21st century; and you have the last 10,000 years doing this [hand goes down] to today; and then BOOM! [hand goes off top off the screen] Outside the elevator y'know. Up and out!"
That is a perfectly valid comment - it places the findings in the wider context.
Some peoples' political and ideological preference may mean they do not 'like' this comment. That's fine, they may like it or dislike it. However, Shakun's comment is in no way in contradiction to what they said in their publication.
By now it is perfectly clear that Watt's and McIntyre's hysterical attempts to misrepresent what the paper actually does/doesn't say is just rhetoric. There is nothing wrong with it, McIntyre is just trying to suggest the paper concerns the 'uptick' - it doesn't. It is about the Holocene.
- Bob Brand
KR,
Regarding sea level, I sketched in the current SLR of 3 mm/yr into global warming art's image of sea level since the last age:
http://ourchangingclimate.wordpress.com/2011/01/18/past-current-future-sea-level-rise-graphs/
Not sure if there is a "proper" graph of this sort, though the data by Foster and Rohling (and others) perhaps allow making one.
Bart
Post a Comment