Sunday, May 15, 2011

Rabett Is Always Right

Back at the beginning of time, Eli pointed out that Tony Watts' Surface Station of the Month Club was turning up as many stations with bad cooling features as with warming ones. Some are shown on the right from Rabett Run's Cool Station of the Day feature back in September 2007. This was not taken well and there were some real classics over there


Ste
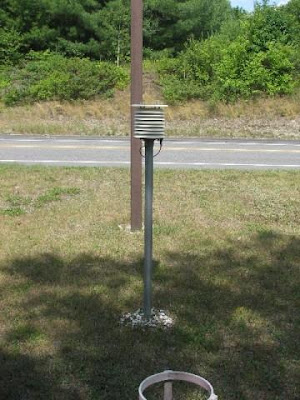
ve Bloom put it well;

So little time, so many baseless assumptions:

1) Eli's point is that your material is basically self-cancelling within its own terms. If he were using it for any other purpose, you might have an argument. As it is, you don't.

[MODERATOR NOTE - on #1 I get what he's trying to say, but we'll see when its all tallied. So far there does not appear to be a balance as has been suggested.]

Well, guess we have. Time to pay up Tony. Since there is no such thing as a free lunch, Eli will accept a dinner.


And then there was maybe Jeff ID with
1) Eli's point is that your material is basically self-cancelling within its own terms. If he were using it for any other purpose, you might have an argument. As it is, you don't.

So, two bad sites make good data, wonderful. I don't like betting my life on crap like this.

Anthony and his volunteers are auditing. They're waiting for the final results before coming to a conclusion.

Steve Mosher puts in a cameo waving his hand wildly about.

Eli summed it up in a comment at Rabett Run
The point is that

a. There are both negative and positive biases at the various USHCN network stations

b. Eli can find a lot more stations with negative biases in the surface station picture gallery.

c. The net effect will be to broaden the distribution, but not change the means (by anything meaningful).

d. That's what you get when you are too cheap to run your own system.
Now Eli is not one to gloat, but simply wishes to point to a paper under discussion

Fall, S., A. Watts, J. Nielsen-Gammon, E. Jones, D. Niyogi, J. Christy, and R.A. Pielke Sr., 2011: Analysis of the impacts of station exposure on the U.S. Historical Climatology Network temperatures and temperature trends. J. Geophys. Res., in press. Copyright (2011) American Geophysical Union.

Which pretty much says Watt Eli Said

Whooda thunk

44 comments:

Anonymous said...

That does look prescient now. And all of Anthony's predictions about what his project would prove have proved wrong.
GN

Anonymous said...

Strange how quickly the report has dropped off the front page of Watts...after years of work you would of thought it would justify a 'sticky'...only on the front page 5 days...

Bob

Anonymous said...

He's too busy trying to come up with excuses for why his paper matches everybody else's on the surface station record to bother actually reporting it accurately to his faithful followers. He couldn't even report about the publication himself, just got RPSr.'s text dump and then went on to make a post complaining about swear words in a climate science rap video.

I noticed in one of the comments replying to Rob Honeycutt, he basically insinuated that a lot of the "good" stations were secretly bad ones.
http://wattsupwiththat.com/2011/05/11/the-long-awaited-surfacestations-paper/#comment-658319

-WheelsOC

Steve said...

Watts has promised his own "write up" of the paper soon, but I just left a second comment, currently in moderation, at the Pielke guest post on WUWT:

"Anthony, over the weekend I found your radio interview with Andrew Bolt in Australia from June 2010 in which you said you estimated that warming bias from siting factors could account for .5 degree C of warming. Andrew then made the observation that this meant that 2/3 of the roughly .7 degree warming of the last century could be due to this alone, and I don’t believe you disagreed.

Is your coming post going to make reference to that specific estimate of only 13 months ago in light of your paper?"

Someone else should listen to the interview (no transcript available, sorry) and make sure I haven't got it wrong:

http://www.mtr1377.com.au/index2.php?option=com_newsmanager&task=view&id=6256

n-g said...

If you get a dinner for correctly surmising that the warm and cold biases would cancel each other, do we get a dinner for proving your surmisation correct?

Steve Bloom said...

Actually, John, by now you've co-authed with RP Sr. so many times that Ed Wegman would probably have bad things to say about you. :)

Reading between the lines, it sounds like you were brought in to help after the initial statistical analysis was flamed by reviewers. So dinners are owed, yes, but I assume you'll be getting yours from the appropriate parties.

Steve Bloom said...

Wow, what a thread that was, terminal censorship and all. The absolute inability of any of them to answer the basic question of the significance of a photographic bias in the absence of a data one was utterly revealing. In particular, a comparison of comments by the old, demonic moshpit with those of the new, angelic moshpit (well, perhaps changeling is more apt) made recently at Innit would be amusing indeed.

BTW, Eli: Please do gloat, extensively.

Oh yes, the publication of Fall et al. and withdrawal of the Wegman hatchet job within a few days of each other is suspiciously synchronous. Does it mean there's some chance of the world actually ending on Saturday? I suppose we can hope not, Lord willing and the levee don't break. Um. (Note to self: Find new folk phrase.)

Last thought, just two words: Fall guy.

Steve Bloom said...

Aha, Fall was Niyogi's PhD student at the time the paper was written. Ed would approve!

Steve Bloom said...

OK, one more:

So, Our Anthony seems to like non-climate posts to distract and entertain the masses. This one's *perfect*.

a_ray_in_dilbert_space said...

And the first course:

A delicious irony that Tony Watt's only peer-reviewed paper contradicts everything he's been saying for a decade. Served in a lovely Schadenfreude sauce.

n-g said...

Steve said "Reading between the lines, it sounds like you were brought in to help after the initial statistical analysis was flamed by reviewers."

No, I was invited to participate about three months before the paper was submitted.

You're right about Wegman, though. At one point a few years ago I was exploring a paper idea with Michael Mann, which if it had come to fruition would really have thrown Wegman's analysis for a loop.

EliRabett said...

Of course Eli would be happy to buy John N-G a dinner, but only if the acknowledgments had a sentence or two like:

"Anthony Watts and Roger Pielke Sr. acknowledge Prof. Dr. Eli Rabett, who, four years ago, in an intense discussion of the underlying data, pointed us in the right direction. We humbly apologize for our doubting the Bunny and promise never to do it again."

Or somethin like that

Anonymous said...

Eli is a very, very smart Bunny. JeffId and Mosher now look incredibly silly...at least Tony is not alone in his delusion.

Perhaps his family can be rewarded by keeping the grass nice and short at some if the sites :)

Anonymous said...

Dear Dr. N-G,

I am curious as to why you said this recently:

"Finally, and perhaps most important, are we really so lucky that the rest of the world would also have its poorly-sited stations have erroneous maximum and minimum temperature trends that just happen to be equal and opposite to each other?"

This, nor your subsequent defense of that statement make any sense to me. For argument's sake let us assume that the answer to your question was "no"-- that is, we were not so lucky that the biases cancel. How then do you explain the excellent agreement between the global satellite temperature data and the global SAT data? I'm sorry, but this fact alone really calls into question the above statement made by you.

Your comment has, unfortunately, been used as fodder for the "skeptics" and to claim that the SAT records are not reliable-- and Watts, a co-author, still seems determined unconvinced, even by his own data. Or worese yet, people seem to be citing the ambiguous trends in DTR as refutation of the greenhouse effect.

While I agree that there is always work to improve these monitoring networks, surely you agree that the global warming signal is robust and not attributable or exaggerated by to station issues?

n-g said...

Anonymous - I didn't intend to cast aspersions on SAT; quite the opposite.

Using woodfortrees.org to plot OLS trends from 1979 to 2010, I get SAT = (+0.40 UAH, +0.43 RSS) and surface = (+0.51 GISTEMP, +0.49 HADCRUT3).

Assuming SAT is correct, what do we expect for the surface? I'd expect a mild amplification of trends from the surface to the troposphere, giving me an expected surface trend of about +0.35.

This is about 30% less than the observed surface trend. The various uncertainties in the various trend measurements mean that these don't necessarily disagree with each other, but they also mean that there's still quite a bit of room for possible biases in one trend or the other, if, like me, you think a potential 30% trend error is worth chasing down for the sake of a better estimate of climate sensitivity.

I think the global warming signal is robust. I also think it may be exaggerated (or even possibly underestimated) by station issues.

Anonymous said...

Dr. Nielsen-Gammon,

Thank you. I understand that it was not your intention to cast aspersions on SAT, but at least one two your co-authors are using this paper to do so.

When using the satellite data we are both assuming that the satellite data do not have any issues and are the gold standard, and I think we can agree that that is not true. So yes, there is uncertainty in both records and when those are considered they are indeed in excellent agreement.

CRU have (www.cce-review.org/evidence/Climatic_Research_Unit.pdf) looked at different sub-samples and found excellent agreement after 1940-1950 (see their Fig. 4.6.4). Again, no reason to believe that biases outside the USA are likely any different, and if so, unlikely that those differences are significant.

CRU also compared the CRUTEM3 data against the ECMWF-interim data, they found that their CRUTEM3 product underestimated the degree of global warming (see their figure 4.6.3). Although, this is probably because the CRUTEM3 data do not adequately capture the rapid warming occurring over the Arctic after 2000.

One could compare the SST trends with the terrestrial trends, but that might be misleading, because the oceans will warm at a slower pace than the land. With that caveat in mind, I do wonder though, how the rate of warming terrestrial SAT, SST and satellite records compare. Also, the ratios of surface warming to near-surface warming over land and ocean, respectively.

I do not get the same numbers as you when I go to woodfortrees.org. I get the following OLS rates of warming between 1979 and 2010:

GISTEMP: +0.1647 C/decade
HadCRUT3: +0.1569
RSS: +0.1391
UAH: +0.1281

The difference in trend between GISTMP and RSS is about 15%, and between GISTEMP and UAH the difference is 27%. The difference in the rate of warming between HadCUT3 and RSS is just over 11%. Dr. Gavin Schmidt quantifies the uncertainty in the GISTEMP and HadCRUT3 as follows:

"For the GISTEMP and HadCRUT3, the trends are 0.19+/-0.05 and 0.18+/-0.04ÂșC/dec."

Anyways Dr. Nielsen-Gammon, I do not wish to appear argumentative. Your statement just did not seem to make sense and was not made with any supporting evidence. Not surprisingly the "skeptics" have jumped all over it.

Anonymous said...

Part II,

Also, Schmidt (2009) has dealt with this very issue of differences between the satellite data and surface data:

Schmidt, G.A., 2009: Spurious correlations between recent warming and indices of local economic activity. Intl. J. Climatol., 29, 2041-2048, doi:10.1002/joc.1831.

"A series of climate model simulations of the 20th Century are analysed to investigate a number of published correlations between indices of local economic activity and recent global warming. These correlations have been used to support a hypothesis that the observed surface warming record has been contaminated in some way and thus overestimates true global warming. However, the basis of the results are correlations over a very restricted set of locations (predominantly western Europe, Japan and the USA) which project strongly onto naturally occurring patterns of climate variability, or are with fields with significant amounts of spatial auto-correlation. Across model simulations, the correlations vary widely due to the chaotic weather component in any short-term record. The reported correlations do not fall outside the simulated distribution, and are probably spurious (i.e. are likely to have arisen from chance alone). Thus, though this study cannot prove that the global temperature record is unbiased, there is no compelling evidence from these correlations of any large-scale contamination."

More here:
http://www.realclimate.org/index.php/archives/2009/11/muddying-the-peer-reviewed-literature/

And really, if the observed trends continue unchanged (unlikely I know) should we really cite a difference between a warming of 1.6 C after 100 years versus 1.3 C over a 100 years as reason for inaction on reducing emissions? I know you in all likelihood do not hold that view, but Mr. Watts does seem to think so.

Again, I agree that your paper has flagged some areas where improvements can be made in monitoring temperatures, let us hope that Watts and Co. encourage the GOP to not cut funding for climate monitoring then.

As for estimates of climate sensitivity, it is my understanding that the global SAT record is not required to do so, multiple, independent lines of evidence point to a best estimate very close to + 3 C for doubling CO2.

EliRabett said...

JNG: Why the amplification? The trop hot spot from models is mostly tropical?

n-g said...

Anonymous -

I agree with my co-authors on some matters, and disagree on others...

Fig. 4.6.4 addresses sampling issues, not biases.

Fig. 4.6.3 helps, but to what extent was the same surface temp data used in HADCRUT3 and ERA reanalyses? Independent analyses would be better, and it would be nice to know whether ERA agrees with SAT too.

OLS: Different units (total T change vs. rate of T change).

Do you have a citation for where skeptics have used my statement to doubt SAT? If so, I'll look into it.

Eli - Half the globe is 30N-30S, so the tropical amplification should project onto the global mean. My numbers are just a guess though and if anyone has estimated TLT from models and compared to surface T I could easily stand corrected.

n-g said...

More Recent Anonymous - Sorry to sound facetious, but I think the proper conclusion is that the other authors thought it was more important to get a more accurate analysis than to settle for an analysis that produced an answer they liked.

Anonymous said...

Dear Dr. Nielsen-Gammon,

Many thanks for your reply. Sorry, I keep forgetting to sign my messages. FWIW, you have been conversing with MapleLeaf.

Yes, their Figure 4.6.4 deals with sampling issues, but those samples also included regions from outside the USA. So surely if sites in locations outside the USA had a significant bias, then that would have been reflected in the temperature traces-- I see no evidence of that.

Re the OLS numbers, you said "trends", buyt then provided delT. I looked at trends. Anyhow, not to worry. I think we sorted that one out, with the exception of questions surrounding the amplification factor.

Good question about their 4.6.3-- I'll see what I can find out.

I am still having a difficult time reconciling your statement that I quoted above. If this hunch so important, then surely it is something that the authors should have explored in more detail, or, in the absence of quantitative evidence, simply not commented on.

"Do you have a citation for where skeptics have used my statement to doubt SAT? If so, I'll look into it."

I'll get back to you on that ASAP.

MapleLeaf

n-g said...

Hi, MapleLeaf!

Oversimplified example: if all non-US stations had a trend bias of 0.05C/decade, Fig. 4.6.4 would be unaffected, except to the extent that the proportion of US to non-US stations may be slightly different in the two samples.

Regarding the hunch thing, which authors are you referring to? If you mean Fall et al. 2011, all we said in the paper about global temperature measurements was "We recommend that this type of comprehensive siting study be extended to the global historical climate network [GHCN] temperature data (http://www.ncdc.noaa.gov/oa/climate/ghcnmonthly/index.php), as part of the improvement in metadata and benchmarking of data adjustment algorithms proposed in the meeting organized by Stott and Thorne [2010]."

Anonymous said...

Dear Dr. N-G,

When you say "Regarding the hunch thing..." I'm not sure that I said anything about a hunch, maybe that comment was made by someone else posting as anon?

Eli and Dr. N-G,

Regarding the tropospheric amplification, I posted something earlier today on that but it must have disappeared down Eli's rabbett hole.

Anyways, you are probably both familiar with this recent paper by Dr. Schmidt:

Schmidt, G.A., 2009: Spurious correlations between recent warming and indices of local economic activity. Intl. J. Climatol., 29, 2041-2048, doi:10.1002/joc.1831.

In which he concludes:

"A series of climate model simulations of the 20th Century are analysed to investigate a number of published correlations between indices of local economic activity and recent global warming. These correlations have been used to support a hypothesis that the observed surface warming record has been contaminated in some way and thus overestimates true global warming. However, the basis of the results are correlations over a very restricted set of locations (predominantly western Europe, Japan and the USA) which project strongly onto naturally occurring patterns of climate variability, or are with fields with significant amounts of spatial auto-correlation. Across model simulations, the correlations vary widely due to the chaotic weather component in any short-term record. The reported correlations do not fall outside the simulated distribution, and are probably spurious (i.e. are likely to have arisen from chance alone). Thus, though this study cannot prove that the global temperature record is unbiased, there is no compelling evidence from these correlations of any large-scale contamination."

Not that he speaks about "large-scale" contamination, that is, including regions outside the US.

Also, I am not sure what to think about your recent comments on Fig. 4.6.4-- we appear to be in broad agreement that the CRU Fig. 4.6.4 seems to suggest that the canceling of biases is probably global, and not just limited to the USA?

Still working on the other stuff, but have some galley proofs to attend to in the meantime.

ML

Anonymous said...

"Sorry to sound facetious, but I think the proper conclusion is that the other authors thought it was more important to get a more accurate analysis than to settle for an analysis that produced an answer they liked."

They didn't have much of a choice, did they? You just spared them further embarrassment.

Please excuse my Schadenfreude, but I find it hilarious that after years of attacks on NOAA, accusations of fraud, junk science and bad statistics, Watts needed assistance from a climate scientist to do a proper analysis, because he didn't have enough brainpower to do it himself!

Marion Delgado said...

Eli:

I feel very much vindicated as well. Note the comment about how "two bad sites make 1 good site????" implying that it's unscientific to "cancel" an "over" with an "under" reading.

I maintained all along that what they proposed to do was to correct any noise and errors (by their criteria, and by the weather station standards they cited) on the low end of a database, then say it was more accurate, because after all, all they're doing is correcting noise and errors?

Then again, there's much vindication to go around.

Marion Delgado said...

For me, seeing Pielke, Sr.'s forlorn name at the end of a paper almost headed by a dim-witted scientifically illiterate TV weatherman is Schadenfreude bait. So thank you, WattsUpYourHowever.

Stu N said...

Quoting Marion: "I feel very much vindicated as well. Note the comment about how "two bad sites make 1 good site????" implying that it's unscientific to "cancel" an "over" with an "under" reading."

Good point. An argument pops up now and then that it's ridiculous for us to be talking of trends of 0.17C/decade, or anomalies of +0.37C, when most readings are taken to the nearest degree. Often the people who make this argument are not satisfied when told that with a statistically large sample the rounding errors cancel out. C'est la vie.

Also, some advice for anonymice: if you actually want a name, select comment as 'name/URL'. You don't actually need a URL to make this work, and then people know who's commenting without having to scroll to the bottom of the commment.

Horatio Algeranon said...

So, does this mean we have now seen the final episode of "All My Surface Stations"?

Or can we expect a titillating new season? (based on the premise that "the best-sited stations, the diurnal temperature range in the lower 48 states has no century-scale trend"?)

Horatio waits with cheese-baited mouse breath...

n-g said...

MapleLeaf -

'hunch': It was you. Just do a word search on your previous comment.

I hope this doesn't degrade into a word-parsing contest, but absence of evidence is not evidence of absence. It may serve to bound the likely magnitude of the possible contamination, but I think the numbers that I threw around earlier fall within those bounds.

We're talking past each other on 4.6.4. All I can think to say is that the test in 4.6.4 would not detect systematic trend biases across large regions of the globe, and if you don't believe me create some artificial data and try it for yourself.

Horatio -

I'm afraid you can look forward to at least one more season. The surfacestations database is a rich one, and there's much to be learned about the effect of particular siting issues. For example, it would be nice to separate the "Eli sites" (shady) from the "Watts sites" (near mechanical equipment) and understand the specific effects as a function of season.

John McManus said...

One Mmre season! Will Anthony wake up and realise the death of his reputation and dignity was just a dream?

Anonymous said...

Dear John, (is it OK if I call you John instead of Dr. N-G?),

No to worry, I am not hear to argue or debate semantics. You are right, I did say "hunch", referring to your "hunch" that we might not be so lucky that the biases cancel outside the US. Upon reflection, that term (hunch) is not accurate characterization of what you said. Sorry for that. However, what I was trying to relay is that if you think such an outcome is indeed possible, would it not be better to quantify that and support it with some numbers, rathe than let some people draw their own preconceived conclusions?

Re 4.6.4. You may be right John. It all depends how the stations are separated out as to whether or not that sampling could identify a bias.

Re the ECMWF-interim comparison with CRUTEM3 in their Fig. 4.6.3. They seem to have adopted the Figures from Simmons et al. (2010). Specifically, they say in the caption for 4.6.3-- "Comparison of surface temperatures over land from CRUTEM3 and the reanalyses, with the reanalyses sampled with the same spatial and temporal coverage as CRUTEM3. (b) Same as (a) but with reanalyses averaged over all land values. [This Figure is the top two panels of Figure 3. from Simmons et al., 2010]." So they are comparing only those grid squares where the have concomitant reanalysis data and CRUTEM3 data in panel (a), and those traces are practically indistinguishable.

Additionally, For these data the reason for the cooler CRUTEM3 temps after 200 is not necessarily only because the CRU analysis is missing the Arctic amplification, but perhaps also because their analysis is missing the warming over portions of Africa and South America.

As for who might be abusing your comment? I Googled "are we really so lucky that the rest of the world would also have its poorly-sited stations have erroneous maximum and minimum temperature trends that just happen to be equal and opposite to each other" and got hits for WUWT and ICECAP (Morano). I'm sure a more rigorous search would yield more hits.

ML

Horatio Algeranon said...

you can look forward to at least one more season

Good to know (where else would Horatio get his material?)

All My Surface Stations
-- by Horatio Algeranon
(after "All My Children", by Agnes Nixon,
creator of the 41-year[!]-running soap opera)

The Hot and the Cold
The Good and the Poor,
The Weak and the Strong,
In Orland and in Marysville,
On Blacktop and on Grass
In Heat and in Cold,
In Tragedy and Triumph,
You are ALL MY SURFACE STATIONS

...and I love you all dearly...even if you did just disprove My Theory...

n-g said...

ML - (4.6.3) That's not the issue I'm raising. I'm asking whether the reanalysis data used temperature data from the same surface stations as went into the CRUTEM3 analysis. If so, then of course they match. If not, then they're independent analyses and their agreement provides some mutual confirmation of their accuracy.

(hunch) I've been used, I've been abused... Both WUWT and ICECAP seem to have quoted my post verbatim without trying to twist my words, so I don't mind that. Much better examples of word-twisting are available in the Deltoid comment thread http://scienceblogs.com/deltoid/2011/05/anthony_watts_contradicted_by.php

In my opinion, the world has not yet seen a decent quantification of the extent to which global land surface temperature trends are constrained by the other available evidence. In an ideal world, we'd have that and I'd be able to attach numbers to my comment. Meanwhile, I don't think "nonzero" should be so controversial.

Anonymous said...

Dear John,

Thanks for your message.

In response to your question, you'd have to look at the Simmons et al. paper. We need to keep in mind that while the ERA-interim ingests the surface data (IIRC), that they were looking at 5 degree grid boxes, so it is not clear how those observe data may have affected the re-analysis data. But in my view, the comparison between the reanalysis data and the CRUTEM3 data do not support the notion that systematic biases exist in the SAT record outside the USA.

And again, the reanalysis data show that if anything, the CRUTEM3 land temperatures are underestimating the amount of warming after 2000.

"Both WUWT and ICECAP seem to have quoted my post verbatim without trying to twist my words, so I don't mind that."

That may be, but we both know that Watts and Morano are in the business of feeding fodder to the skeptics, and in the case of Marc Morano, the disinformation business. Sometimes the fodder is blatant, sometimes it is much more subtle. And as I said, that was just a super quick search, I did not wade though comments at WUWT to see how many people may have people misinterpreted your comment. I saw two posts about your comment at Deltoid, you seem to be referring to dhogaza's comment. When there, however,I did see this interesting interpretation of the study's findings by Pilke Snr:

"We found that the poor siting of a significant number of climate reference sites (USHCN) used by NOAA's National Climatic Data Center (NCDC) to monitor surface air temperatures has led to inaccuracies and larger uncertainties in the analysis of multi-decadal surface temperature anomalies and trends than assumed by NCDC."

What are your thoughts on that?

John N-G: "In my opinion, the world has not yet seen a decent quantification of the extent to which global land surface temperature trends are constrained by the other available evidence"

I do not understand this comment, Hansen and others all provide error bars for the SAT data trends, and they are currently around near +/- 0.05 C/decade. You seem to think that, if your hypothesis is true, that the actual global rates could lie outside these bounds? Possible, but highly unlikely. No? We do the best we can, and there is always room for improvement, but I doubt very much that this work even hints at a paradigm shift.

ML

n-g said...

"What are your thoughts on that?"

Roger thinks that the differences in max and min trends among stations imply that the mean trends may have uncertainties comparable to those differences. I don't see it that way. It's an open question deserving of a more rigorous analysis.

Fall et al. 2011 a paradigm shift? Certainly not.

Zeke said...

To be fair, its likely that there are systemic bias factors (TOBS, instrument moves, instrument changes, UHI, etc.) that are poorly quantified and increase the error ranges somewhat beyond those reported by HadCRU et al, but whether or not these biases lead to net warming or net cooling (or largely cancel out) is still somewhat of an open question. In the U.S., for example, it seems like the cooling biases (MMTS, TOBs) more than outweigh the warming biases, though it will not necessarily be the same elsewhere.

Anonymous said...

Any thoughts on this paper?

http://www.cgd.ucar.edu/cas/adai/papers/Zhou_etal_ClmDyn2010.pdf

In which they conclude,

"When anthropogenic and natural forcings are included, the models generally reproduce observed major features of the warming of Tmax and Tmin and the reduction of DTR. As expected the greenhouse gases enhanced surface downward longwave radiation (DLW) explains most of the warming of Tmax and Tmin while decreased surface downward shortwave radiation (DSW) due to increasing aerosols and water vapor contributes most to the decreases in DTR in the models. When only natural forcings are used, none of the observed trends are simulated. The simulated DTR decreases are much smaller than the observed (mainly due to the small simulated Tmin trend) but still outside the range of natural internal variability estimated from the models."

Looks like allowing for the biases, over the USA at least, brings the models in better agreement with the simulated changes in DTR. Also, Watts and Pielke should not over sell the absence of a signal in the DTR in the USA data, because the models do not predict a statistically significant decrease there.

ML

Anonymous said...

Hi John,

Just some more thoughts on the reanalysis. IIRC, the assimilation of observations in the reanalysis constrains or nudges the model fields, but that doesn't necessarily mean they are the same. Indeed, see this paper from Mooney et al. (2010) in which they compare various reanalysis products with observations:

http://onlinelibrary.wiley.com/doi/10.1002/joc.2098/full

"Summary statistics and the monthly mean temperatures over the 1989–2001 period showed that the reanalyses were significantly warmer in winter than the observations, which resulted in best fit lines with slopes consistently less than unity."

Or were the surface stations too cool? I stumbled on this paper while trying to track down Simmons et al. (2010).

And for buoy data;

"Comparison of ERA-Interim and NNRP-1 data with the air temperatures at four marine buoys around the Irish coast for the period 2001–2005 showed that the reanalyses modelled colder winter temperatures than the observations."

Yet, on large spatial and temporal scales the values are in excellent agreement between ERA-interim and the observations.

n-g said...

ML - I agree with your interpretation of Zhou et al. But if I keep responding to every citation, I'll never get a chance to put together my DTR post...

Anonymous said...

Hello John,

Good that we are in agreement. Hope that this exchange did not come across as combative from my side.

Appreciate and value your thoughts, and learnt a few things in the process, so thanks.

I'll stop bugging you now.

ML

n-g said...

ML - No worries.

Anonymous said...

Reminds of the little toilet wall dittie.

Here I sit
Broken hearted
Paid my penny
And only farted.

How many years has he had that project on the boil. On his own website, what did it amount to. Nothing.

Anon(1)

Sou said...

Looks like I've been missing some fun and games. It's probably good that a lot of people have found their life's calling and are keeping themselves busy measuring measurements from temperature measuring thingamabobs. A lot of us don't really need that level of quibbling, even though it's a fascinating pastime and could even be better than playing indoor bowls or solitaire, and much better than shooting rabbits.

What some of us are more interested in is what is being done to stop the world from warming. This decade has been a killer, literally, with death from fire and death by water. Where I live and in a lot of other places around the world, we've had the hottest days ever recorded and the wettest days ever recorded. We've felt it and seen it and I'm old, so I know not just from life experience but by looking at the records, that we've done a lot of harm to ourselves.

It would be great if as much effort went into weaning us off burning carbon as goes into taking photos of thermometers.

moddress.co.uk said...

Looks like I've been missing some fun and games. It's probably good that a lot of people have found their life's calling and are keeping themselves busy measuring measurements from temperature measuring thingamabobs. A lot of us don't really need that level of quibbling, even though it's a fascinating pastime and could even be better than playing indoor bowls or solitaire, and much better than shooting rabbits.