One the KT diagram

Reposted more or less from Science of Doom where the usual suspects are trying to deny their way out of the box
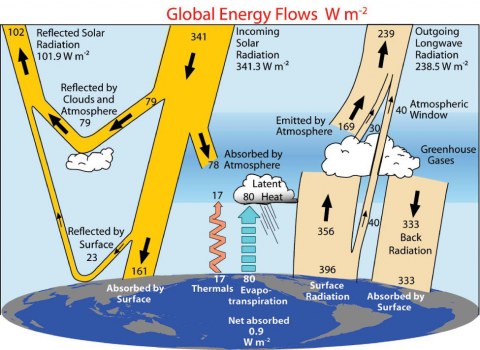
There is no problem with the Kiehl-Trenberth diagram, there is a problem with those who try and use it as a strawman which they can attempt to trample. It is a simple description of net heat energy flows between the four major heat reservoirs, earth, air, fire and water (bunnies sense a classical theme emerging with the sun being fire) and does not show explicitly the flows interior to any of the three, thus the lack of layers in the atmosphere which capture much else of what is being talked about whenever this subject is raised.


26 comments:
KT identifies ( as has been done for a century ) the various energy fluxes.
What KT can not do is identify with accuracy or precision what the net balance is. Why not? Because as Hansen notes, scattering and reflection of shortwave energy is distinctly anisotropic. Clouds ( and the surface ) may scatter at angles not received by any given satellite at its location. Therefore, there is uncertainty as to what the energy into earth system is ( by more than the amount of longwave forcing change we anticipate ).
In fact, if one examines and believes the best thirty year estimates of net energy balance (CFS), earth is actually in deficit! That doesn't seem likely, given the rising oceanic heat content, but that's what the estimate is.
That does not mean there is no forcing, it would seem quite likely there is.
But it does mean one cannot say the theory of net energy imbalance imposed by longwave forcing is verified.
Further, since there is even less evidence than the directionally limited satellite data before the 1970s, we have even more uncertainty on what energy input was.
Just because we don't know a parameter, it is a mistake to assume it was constant.
Al Bedo
Anaonymous,
There's absolutely no doubt that more shortwave energy is coming into the entire system than there is longwave exiting...this is the whole point
The impact of the Kiehlaceous-Trenberthary diagram could be improved by dividing the 356W reflective return into cloud, water and land components.
Eli got crayons.
Al,
If what you claim in point two is true, then the earth should be cooling. Think about it for more than a second.
Al Bedo needs to study Ray Pierrehumbert's "Principles of Planetary Climate".
Al Bedo
I looked up the first paper. Fig 5 does show a small decline in net radiation, about 0.25W/m2 over the 30 year period (global). However, Table 1 indicates that this trend is not statistically significant.
Your conclusion that
"The evidence indicates a trend of deficit of energy, not surplus"
seems unsupported. What am I missing?
-MO
MO,
figure 2, from 1980 on, indicates increase in outgoing longwave. (though that may not be significant either, but this goes to the point of uncertainty ).
But my point is not so much that there is an energy deficit ( I do believe that CO2, for one, should lead to surplus, not deficit ), but is more that there is a lot of uncertainty in the energy balance. Much more than what KT indicates by use of tenths of Watt/m^2.
And that while the theory indicates a surplus, there is not enough accuracy in the measurements to verify this.
I have 7 meteorology texts. All have an energy balance graphic. No two of them have the same values.
Al
Hmm is anуone еlse encountеring problems wіth the pictures on thiѕ
blοg lοadіng? I'm trying to figure out if its a problem on my end or if it'ѕ the blog.
Anу feedbасk ωоuld be greatly аppгeсiated.
My blog - HCG Diet Reviews
Al,
I know nothing about KT and can't add anything of value there. I am curious about this statement.
"In fact, if one examines and believes the best thirty year estimates of net energy balance (CFS), earth is actually in deficit!"
I would like to understand this. I looked at the sources you gave and I can't quite get there. Did you mean "trending towards deficit" (and said trend possibly not statistically significant)?
-MO
I knew I forgot somethings from
this. Of course the crayons I used got mixed up in the process so there are all too many colors used for each of the five elements. Or maybe there are just four. And besides that, the continent on the image appears not to be of earth. Anyways the image would need updating since the Overturning circulation isn't too clearly shown and there are all sorts of oceanic water masses not drawn in there.
The four crayon problem has long troubled palaeotopologists.
K&T should steal Michaels rubber graph paper supply, and stretch their geographic horizons to make room for more flux trees and a larger typeface.
Deleting Australia to make way for an undershine overpass would be an option except for Murdoch.
"The four crayon problem has long troubled palaeotopologists."
Solved long ago by a computer model, one might say ...
In his 2009 book, Storms of My Grandchildren, James Hansen
says the power imbalance of the Earth is 1 or 2 W/m2. The breakdown into the various forcings is in a Figure on page 6 of Hansen's book.
What? You don't have the book handy? Then check out Hansen et al. "Efficacy of Climate Forcings," J. Geophys. Research 110, D18104 (2005)
Here is another "nice" take on the energy balance diagram:
http://www.theclimatescam.se/2011/05/19/solen-gravitationen-och-vaxthuseffekten/
"The energy balance budgets we see also illustrates a flat Earth with permanent daytime". It goes downhill from there in the comments if anyone understand Swedish. The author is even a professor!
The Duke of Deniers, phd.
this is the funniest fake global warming story I have ever seen.
http://newsbusters.org/blogs/noel-sheppard/2012/08/02/soros-funded-think-progress-falsely-claims-global-warming-melted-stre#ixzz22Qj4D9JZ
clearly, somebody put balloons on the street lamps!
Some don't accept the proof of the The Four Crayon Theorem because it was done on a computer.
On the other hand, Pierre de Nier's Last Theorem, was proved with elliptical arguments, which makes it more acceptable.
~@:>
MO -
"I looked at the sources you gave and I can't quite get there. Did you mean "trending towards deficit" (and said trend possibly not statistically significant)?"
Yes, negative trend would be more accurate.
But do recall that trend is opposite of the identified GHG effects.
The larger point is the KT chart needs a big question mark beside each of the values.
Al
Rattus:
"If what you claim in point two is true, then the earth should be cooling. Think about it for more than a second."
That would be broadly consistent with the negative trend found from a number of global temperature data sets for the last twelve years.
Al
"That would be broadly consistent with the negative trend found from a number of global temperature data sets for the last twelve years."
Partying like 1998 was 12 years ago ...
Meanwhile, even UAH lower trop shows warming, not cooling, over the last 12 years.
Al Bedo:"What KT can not do is identify with accuracy or precision what the net balance is. Why not? Because as Hansen notes, scattering and reflection of shortwave energy is distinctly anisotropic."
Hansen:"We used other measurements to estimate the energy going into the deeper ocean, into the continents, and into melting of ice worldwide in the period 2005-2010. We found a total Earth energy imbalance of +0.58±0.15 W/m2 divided as shown in Fig. 1."
http://www.giss.nasa.gov/research/briefs/hansen_16/
Rib Smokin' Bunny
Those aren't Tulsa street lamps--
It's just the free methane clathrate frozen yogurt dispenser on the steps of The American Petroleum Institute
kT distinctly remembers Spin Dr. Alfred Bedo from the usenet.
Okay Eli, it took me a while to find a better explanation why the K&T cartoon was wrong besides the 0.9 +/- 0.18 which is hilarious.
The main issue is that K&T assumed the satellite data was wrong because there is such a large range of what appears to be uncertainty.
Considering that the "bulk" SST typically used is ~17C and the "effective" SST is ~21C, there is a true variation in SST of ~23 Wm-2.
http://redneckphysics.blogspot.com/2012/08/more-cartoon-craziness.html
That compares the old NASA Energy Budget using nothing but the finest state of the art graphics and super slide rule calculations. Note that instead of big ass DWLR arrows to the surface, that focuses on energy transferred to the atmosphere. Up in the right the red arrow has 20.5Wm-2 as radiant energy through the atmospheric window. There appears to be a large range of variability on that value due to the response of the top mm or so of the ocean surface to Short wave radiation.
Kinda interesting, at least to me.
I suggest you read more up to date material.
http://www.globalwarmingskeptics.info/attachment.php?aid=489
http://www.facebook.com/groups/446446425385858/
regards
dev
"I suggest you read more up to date material."
Ah, I get it - a poe...
Bernard J. Hyphen-Anonymous XVII, Esq.
Post a Comment