Christy and McNider Fall Into the "Warming Hole"

In the history of science, it is well known that motivated reasoning can revisit any number of old results in ignorance, be it accidental or not, of previous work. With bad luck authors of such a revelation have their work sent to those who have done the previous or perhaps just read it and remembered. With bad luck for the rest of the world not.
John Christy and Richard McNider have form on such things, and, of course Eli is talking about their latest damp squib, Time Series Construction of Summer Surface Temperatures for Alabama, 1883–2014, and Comparisons with Tropospheric Temperature and Climate Model Simulations, which appeared in the Journal of the American Meteorological Society C.
Victor Variable is. . . dubious
This post gives just few quick notes on the methodological aspects of the paper.Tamino has torn this apart showing that it is the result of a stroll through the garden of forking paths looking for something pleasing to the authors state of mind, that of all the ways to dice and slice the data the only one that met their requirements was summer surface temperature maxima in the state of Alabama
- They select data with a weak climatic temperature trend.
- They select data with a large cooling bias due to improvements in radiation protection of thermometers.
- They developed a new homogenization method using an outdated design and did not test it.
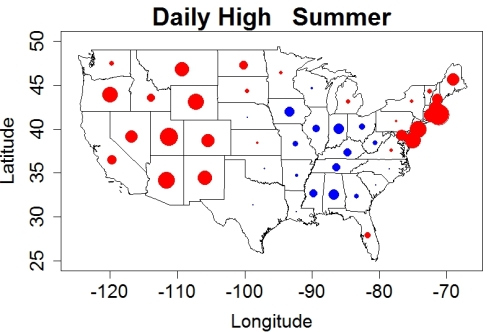
This, as it were rang a bell in Eli's chime factory, taking the Bunny back to the late great Nature Blog which, sad to say, essentially died in childbirth when they invited Roger Pielke Jr. to submit a rather Roger Pielke Jr. ish piece of work, which, as is usual with Roger Pielke Jr. ish blog posts at Rolladex impressed large sites (think 538) promptly crashed on takeoff. Eli had some fun over there, but what stuck in the Rabett's thinkeria was the graphic of cooling in the southeast US.
Buried down, way at the bottom, was a comment from Jim Angel
The area in the southeast US certainly contains enough data and is actually a light shade of blue and represents cooling trends on the order of -0.2 to -0.5C in the lightest shade and -0.5 to -0.8 in the next darkest shade. It’s unfortunate that they chose such ambiguous colors for these two important distinctions. Three of the pixels show a statistically significant cooling trend during this time period.
BTW, this so-called “warming hole” in the 20th century has been addressed in a few papers. For example,
Kunkel, K.E., X.-Z. Liang, J. Zhu, and Y. Lin, 2006: Can CGCMs simulate the Twentieth Century “warming hole” in the central United States. J. Climate, 19, 4137–4153.which, in the intro, states that
Trends in temperature during the period 1976–2000 for the summer season only (Folland et al. 2001) show an area of cooling in the central United States, centered somewhat to the north and west of the center of the area of annual cooling found by Folland et al. (2001) for the entire twentieth century; this area of summer cooling was termed a “warming hole” by Pan et al. (2004). Robinson et al. (2002) analyzed the 1951–97 period and found annual cooling in the south-central United States, centered somewhat to the west of the twentieth-century annual cooling area and to the south of the 1976–2000 summer cooling area, although overlapping both. The term warming hole will be adopted here to refer to the general phenomenon found in all of these studies while the region to be studied will overlap all of the above areas and will be defined based on both physical and societal considerations. In addition to the lack of warming on a centennial time scale, the multidecadal variations are an interesting and integral aspect and will be examined along with the century-scale trends.Folland et al is Chapter 2 of the IPCC WG1 TAR so not exactly hidden away and Pan et al is also out in the open, but the Google does well with "warming hole" taking Eli to a NASA web site that talks about a 2012 paper by Leibensperger, et al, which finds that
. . the regional radiative forcing from US anthropogenic aerosols elicits a strong regional climate response, cooling the central and eastern US by 0.5-1.0 °C on average during 1970-1990, with the strongest effects on maximum daytime temperatures in summer and autumn. Aerosol cooling reflects comparable contributions from direct and indirect (cloud-mediated) radiative effects. Absorbing aerosol (mainly black carbon) has negligible warming effect. Aerosol cooling reduces surface evaporation and thus decreases precipitation along the US east coast, but also increases the southerly flow of moisture from the Gulf of Mexico resulting in increased cloud cover and precipitation in the central US. Observations over the eastern US show a lack of warming in 1960-1980 followed by very rapid warming since, which we reproduce in the GCM and attribute to trends in US anthropogenic aerosol sources.

and, oh yes, the conclusion
Our model results show that US anthropogenic aerosols can explain the observed lack of warming over the eastern US from 1930 to 1980 followed by very rapid post-1980 warming. Without US anthropogenic aerosol sources, we find in the model a relatively constant rate of warming over the 1950–2050 period, driven by increasing greenhouse gases. Increasing aerosols until 1980 offset the warming. Decreasing aerosol after 1980 accelerated the warming due to the loss of the aerosol cooling shield. We find that the observed warming from 1990 to 2010 is significantly greater than would have been expected from greenhouse gases alone.That aerosol has a lot of coal and uncontrolled auto exhaust in it. Good news is that the air is cleaner. Bad news is that the US Southeast is warming up even more. There is more work on this issue.
None of these papers are referenced by Christy and McNider. Perhaps Eli should Google it for them


11 comments:
So I suppose that Christy and McNider will be retracting as soon as possible?
Eli,
I'm sort of thinking that the Leibensperger is somewhat of a tangent to C&M16.
Figure 6 of Leibensperger shows 'organic carbon' and that one almost makes sense, but then again IANAC, you are. I'm sort of thinking that that is somewhat representative of the moisture/precipitation that the Deep South receives from the GOM.
I think that C&M16 are attempting to do two long standing issues for Christy: (1) trash the models and (2) justify the TLT time series.
C&M16 only doing AL is, in their minds, a safe harbor, after all, if I'm not mistaken, Cristy is the AL state climatologist ...
http://nsstc.uah.edu/aosc/
"... providing climate data and research for the state and for the world."
I don't expect the course scale of the CMIP5 models have the ability to properly couple the GOM to the SE USA. I'm pretty sure AL is not a good proxy for the whole world (particularly the 70% that is water).
In some ways C&M16 are echoing the "Senior effect" in that anthropogenic land use changes are affecting mixing at the surface (e. g. nighttime temperatures). If that conjecture were true, then AL is a very poor place to plant that flag. The SE is still predominately rural. A;sp picking a region with a very low trend says nothing about areas like the Arctic that don't have a very low trend and are also extremely rural, last time I checked.
But now you got me wanting to look at the CONUS temperature time series versus the CONUS TLT time series (gridded, but I'm such a n00b with the *.nc file format).
Everett, there is a literature that Christy and McNider ignored.
Could the "warming hole" also be the region where irrigation has increased most in the last 132 years? The region has a nice-sized river to feed the irrigation.
On average irrigation reduces temperatures by about 1°C (Cool et al., 2011). (Weather stations are more common in agricultural regions because they are important for argo-meteorology.)
Benjamin I. Cook • Michael J. Puma • Nir Y. Krakauer. Irrigation induced surface cooling in the context of modern and increased greenhouse gas forcing. Clim Dyn (2011) 37:1587–1600, DOI 10.1007/s00382-010-0932-x
Eli, there is literature that Hansen16 ignored.
One can say that about most any paper.
Having said that, this is an interesting game, finding relevant papers not cited.
But 1st, I will admit that there reference list is very 'weak' and 'lame' as I see only one relevant reference to SE temperature/precipitation climatology ...
Rogers, J. C., 2013: The 20th century cooling trend over the southeastern United States. Climate Dyn., 40, 341–352
Here's another paper C&M16 missed (citing the above paper) ...
Trends in Daily Temperature and Precipitation Extremes for the Southeastern
United States: 1948–2012
https://www.researchgate.net/profile/Barry_Keim/publication/273496723_Trends_in_Daily_Temperature_and_Precipitation_Extremes_for_the_Southeastern_United_States_19482012/links/55493f4a0cf2ebfd8e3adaab.pdf
Here's another 'warming hole' paper ...
Attribution of the United States ‘‘warming hole’’: Aerosol indirect effect and precipitable water vapor
http://www.nature.com/articles/srep06929?WT.ec_id=SREP-704-20141111
Google Scholar -> "United States" "Warming Hole" <-
https://scholar.google.com/scholar?q=%22United+States%22+%22Warming+Hole%22&btnG=&hl=en&as_sdt=0%2C25
About 309 results (0.04 sec)
I still stand by this statement from my previous post though ...
"I think that C&M16 are attempting to do two long standing issues for Christy: (1) trash the models and (2) justify the TLT time series."
A sad demonstration of the apparent correlation of intelligence and longitude
Christy and McNider discuss their choice of data, yet, it appears that they forgot to actually list the sites which they used. There are 3 sites from the CRN on their list, perhaps those which are located near large lakes formed by TVA dams, such as Scottsboro, Guntersville and Muscle Shoals. Those lakes were added during the 1930's, so one might expect to find some cooling trend afterwards.
Th their credit, C&M mention land use change, but don't discuss how their method would account for these slowly evolving effects. For example, the invasion of the Boll Weevil from Texas across the Deep South resulted in the conversion of many farms into tree plantations. Having been raised in Atlanta before A/C, it was my experience that living in a forested area was considerably cooler in summer compared with the experience of open land.
VV tweeted something along those lines, that irrigation could depress temperature during the summer
Checking out who I just 'spammed' with my tweet, and here I find the first post I see referencing motivated reasoning. Nice!
Living on the same hillside since the early '60s I can confirm that the Clean Air Act had an impact on aresoles…it created the Asian "brown cloud" with its–last I knew (& it must be greater now)–15% reduction in solar incidence. But buttressing CapitalismFail is the role motivated reasoning plays for deniers, so finding data that might support uncertainty, is work-well-done. For the light-green climate hawk crowd, who feel understanding CapitalismFail is beneath them–and, apprapo to the function of motivated reasoning, a sense of being moral–a Scarlett O'Hara "I'll think about it tomorrow" gets too much creadance to be clear-headed thinking.
CapitalismFail is a failed functional religion thanks to motivated reasoning./? https://andthentheresphysics.wordpress.com/2016/05/01/maybe-we-really-are-screwed/#comment-77853
Another fact which Christy and McNeider "forgot" in their paper. The TLT v5.6 uses the old algorithm to adjust the MSU2 data which takes scan positions 3, 4, 8 and 9 and applies a correction by differencing with scan positions 1, 2, 10 and 11. Scan positions 5, 6, and 7, ie., the middle of the swath, are not used. However the results of this calculation are "binned" into the grid box corresponding to the nadir position, that is, scan position 6, (as I understand it). The swath width is 1894 km and the middle 3 cover 335 km. At the equator, the swath crosses 17.5 degrees of longitude and at higher latitudes, this longitudinal coverage will increase.
As a result of these facts, almost none of the actual MSU data binned into the grid box at nadir will correspond to that location. That might not be a problem when the longitudinal data is averaged zonally in order to compute hemispherical, tropical or polar results. But, C&M apparently use a the data for the single grid box over Alabama in their comparison, so it would not be surprising that they found little agreement with their time series of surface data...
Groan, must remind myself to remember to check facts. Going back to S&C 1992b, I found that they assign the number from the TLT calculation "to only the middle three scan position locations". So, if the western most scan position is over the Alabama grid box, the eastern edge of the swath would extend 1022 km to the east, thus out over the Atlantic. If things are reversed and it's the eastern scan position which is over Alabama, the western swath would extent 1022 km toward the west, approaching Texas...
Post a Comment