Tom's trick and experimental design

By now all the bunnies are all familiar with"Mike's trick". How Michael Mann realized that if you want to show global temperature anomaly changes and your proxies end in 1980, you show the trend into the late 1990s by using the more reliable instrumental records.
But Tom Karl has a pretty good trick too. Realizing that it was impossible to jump back into the wayback machine and improve the COOP stations in the US Historical Climate Network he set up the US Climate Reference Network,
Its primary goal is to provide future long-term homogeneous observations of temperature and precipitation that can be coupled to long-term historical observations for the detection and attribution of present and future climate change. Data from the USCRN will be used in operational climate monitoring activities and for placing current climate anomalies into an historical perspective. The USCRN will also provide the United States with a reference network that meets the requirements of the Global Climate Observing System (GCOS). If fully implemented, the network will consist of about 110 stations nationwide. Implementation of the USCRN is contingent on the availability of funding.
 As Eli put it In other words, here is a sensible way of checking the accuracy of older climate networks in the past and calibrating them in the future. Pictures of stations in the network can be found on the web site. The stations are designed to be optimal, with respect to location, instrumentation and operation. The USCRN design is paired, that is the USCRN stations are near USHCN stations and the results of the network compared. Indeed, the Menne paper (Excellent discussions here, here, here, and here, Class 5 discussions here. Snit fit here) does exactly that showing that not only are the temperature anomalies from the best and worst USHCN stations identical, but that they also overlay those of the USCRN. Coupled with the excellent agreement over a now thirty year period between the various MSU and surface station temperature anomalies (NOAA, GISSTemp, HadCRUT) sensible people understand that properly constructed global temperature anomalies such as GISSTemp, HADCRUT, RSS, and UAH are yielding an accurate and precise picture of global climate change. That Karl's Trick (TM- ER) is working is the real take home from the Menne paper.
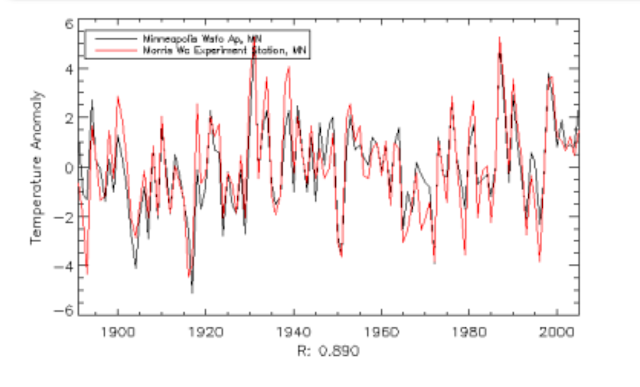
In 2008 Friend Atmoz had pretty well shown that Pielke Sr. and Watts were on a snipe hunt with their surface station picture show. Atmoz first looked in detail at two of the best US HCN stations in Minnesota, finding that the correlation between stations ~220 km apart was greater than 0.9 using the raw data from the USHCN archive. One of these was in a rural location, in a field, and the other at an airport (the Watts boys are moaning about airports not being real good stations, but Atmoz has preemptively shown that this is just shinola). Furthermore Atmoz showed that the correlation between what Watt's called an awful station, Detroit Lakes, and the good stations was also very high (> 0.8)
Atmoz's conclusions were
 This and the graph from Menne at the top shows that Karl's trick is working. Although we only have seven to eight years of the CRN, that is enough to show that neighboring US HCN and CRN stations measure the same high frequency variations in temperature anomalies and it is unlikely that long term trends will differ. It is also a clear validation of GISSTemp's assumption that measurements at locations considerable distance from each other are strongly correlated and that one can make use of that correlation to estimate temperature anomalies at locations which are not directly measured.
But there is more, faithful readers, that is but the half of it. The strength of Karl's Trick (TM ER) is that the CRN was carefully designed. Among other things, NOAA figured out that they only needed ~100 stations to adequately determine climate trends for the US. They were also careful to site CRN stations near USHCN stations, they over instrumented them and more
Contrast this with the helter skelter Surface Stations nonsense. Today Watts moans that
Surveys can be corrected for population density if you know what the population density is, and area averages are easy to do. Over-representation of urban/suburban stations can thus be corrected for if one really wants to know the answer.
Oh yeah, can't resist pointing out that in 2007 Eli noted that
- This area of the USHCN is over-sampled [ER- holds for all of the US except maybe Alaska]
- CRN ratings as applied by surfacestations.org do not contribute a great deal to yearly average temperatures
- The urban heat island (UHI) may not have a large effect in this region [ER-Note this refers to the anomalies]
- Local heat sources, such as airplanes and air-conditioners, have only a small influence upon the temperature record [ER - at least as far as the anomalies]

But there is more, faithful readers, that is but the half of it. The strength of Karl's Trick (TM ER) is that the CRN was carefully designed. Among other things, NOAA figured out that they only needed ~100 stations to adequately determine climate trends for the US. They were also careful to site CRN stations near USHCN stations, they over instrumented them and more
Contrast this with the helter skelter Surface Stations nonsense. Today Watts moans that
Texas state Climatologist John Nielsen-Gammon suggested way back at 33% of the network surveyed that we had a statistically large enough sample to produce an analysis. I begged to differ then, at 43%, and yes even at 70% when I wrote my booklet “Is the US Surface Temperature Record Reliable?, which contained no temperature analysis, only a census of stations by rating.
The problem is known as the “low hanging fruit problem”. You see this project was done on an ad hoc basis, with no specific roadmap on which stations to acquire. This was necessitated by the social networking (blogging) Dr. Pielke and I employed early in the project to get volunteers. What we ended up getting was a lumpy and poorly spatially distributed dataset because early volunteers would get the stations closest to them, often near or within cities.
The urban stations were well represented in the early dataset, but the rural ones, where we believed the best siting existed, were poorly represented. So naturally, any sort of study early on even with a “significant sample size” would be biased towards urban stations. We also had a distribution problem within CONUS, with much of the great plains and upper midwest not being well represented.
This is why I’ve been continuing to collect what some might consider an unusually large sample size, now at 87%.Even at 33% there were more than enough stations. So how do we interpret Watts' lament. Well, if it were Watts alone maybe he should attend an experimental design seminar, but since Roger Pielke Sr. is pulling the strings, this can only be seen as an attempt to put off the evil day they are now confronting. Is this evidence of bad faith, why yes.
Surveys can be corrected for population density if you know what the population density is, and area averages are easy to do. Over-representation of urban/suburban stations can thus be corrected for if one really wants to know the answer.
Oh yeah, can't resist pointing out that in 2007 Eli noted that
UPDATE: Following the crumbs left by the mice (Dano and Chuck) in the comments below, Eli observes that this is exactly what Roger's survey is designed to do with its bias, nay more than bias, prejudice for photographing sites close to people, e.g. in developed areas. Folk are going to take pictures of sites near them, so they are going to get a sample heavily tilted towards sites near them. It will be fun to correlate the locations of sites photographed with voting patterns. Of course we have the American speaking bias on top of that.Comments?


23 comments:
Thanks for highlighting the lost carrot here - how good an idea it was to set up the CRN network.
I'd suggest a minor wording issue: GISS doesn't make the 'assumption' that anomalies spatially correlate; they showed it quite clearly in Hansen (1987). Atmoz demonstrated it for a couple pairs; Hansen showed them all.
One among many papers that Watts might do well to read. Then he can move on to degrees of freedom.
MarkeyMouse quotes from Watts:
"I believe the way NCDC conducted the analysis gives a false impression because of the homogenization process used. As many readers know, the FILNET algorithm blends a lot of the data together to infill missing data. This means temperature data from both well sited and poorly sited stations gets combined to infill missing data. The theory is that it all averages out, but when you see that 90% of the USHCN network doesn’t meet even the old NOAA 100 foot rule for COOPS, you realize this may not be the case.....
Essentially, in my opinion, NCDC is comparing homogenized data to homogenized data, and thus there would not likely be any large difference between “good” and “bad” stations in that data. All the differences have been smoothed out by homogenization (pollution) from neighboring stations!
The best way to compare the effect of siting between groups of stations is to use the “raw” data, before it has passed through the multitude of adjustments that NCDC performs. However NCDC is apparently using homogenized data. So instead of comparing apples and oranges (poor sited -vs- well sited stations) they essentially just compare apples (Granny Smith -vs- Golden delicious) of which there is little visual difference beyond a slight color change.....
When I looked at SHAP and FILNET adjustments a couple of years ago, one of my principal objections to these methods was that they adjusted “good” stations. After FILNET adjustment, stations looked a lot more similar than they did before. I’ll bet that the new USHCN adjustments have a similar effect and that the Talking Points memo compares adjusted versions of “good” stations to the overall average.....
As for the Menne et all 2010 paper itself, I’m rather disturbed by their use of preliminary data at 43%, especially since I warned them that the dataset they had lifted from my website (placed for volunteers to track what had been surveyed, never intended for analysis) had not been quality controlled at the time. Plus there are really not enough good stations with enough spatial distribution at that sample size. They used it anyway, and amazingly, conducted their own secondary survey of those stations, comparing it to my non-quality controlled data, implying that my 43% data wasn’t up to par. Well of course it wasn’t! I told them about it and why it wasn’t. We had to resurvey and re-rate a number of stations from early in the project....
A 0.9F (0.5C) warmer offset due to modernization is significant, yet NCDC insists that the MMTS units are tested at about 0.05C cooler. I believe they add this adjustment into the final data. Our experience shows the exact opposite should be done and with a greater magnitude."
http://wattsupwiththat.com/2010/01/27/rumours-of-my-death-have-been-greatly-exaggerated/
Rabbett, you seem to be having some trouble with comprehension, or is it the eyesight? More carrots perhaps? Or should you try reading in the dark?
Wait till Watts has finished, then criticise. You'll only embarass yourself otherwise.
Wait till Watts has finished, then criticise.
Oh, the irony!
Both Watts' published manuscripts have concluded the US temp record is unreliable. He bases this on photographs of stations that 'possibly' and 'likely' and 'may' have site issues, and picks out a sub-sample of time series from individual stations - but he has never quantified the results. Watts has not finished, as you say, but he has done nothing but criticize.
Applying your admonition to Eli equally, I assume the embarrassment you feel about Watts must be crippling.
Hareling.
Did Watt actually read the paper? From Menne et al. 2010:
"The two types of stations were then treated as separate sub-networks"
No "well sited and poorly sited stations gets combined to infill missing data" at all. But you know, the denailsts camp do not care about details, the words of their Emperor suffice.
Riccardo
By the way, I exaggerated a bit in the first comment. Hansen didn't show every pair, but some large number of randomly selected pairs.
Markey: What are you, some sort of demented cat, who brings dead things to its owner, and thinks it accomplished something? We know what Watts said, and there's nothing to it. Already been discussed. It's bad enough that Watts doesn't understand much; it's worse that you probably don't even understand what he said.
The bulk of Watt's complaint about homogenisation was explicitly anticipated by Menne and pre-emptively discussed. That's why they show results for unadjusted data, TOB-adjusted only (where each station is considered independently of its neighbors), and the fully adjusted set. You can see that what he's vaguely afraid of is not happening. And then, there's still the match to CRN.
Riccardo: Careful there, I think you may have misread. The section you want to quote begins "Moreover, Table 1 provides evidence that a positive bias has not simply been transferred
from poorly sited stations to well sited stations during the pairwise adjustment procedures."
The section you quote is about the gridding to find national spatial means. I do not think they actually repeated the homogenisation, keeping the two networks separate.
corrot eater,
In section 2. Methods, they say
"we formed two subsets from the five possible USCRN exposure types assigned to the USHCN stations by surfacestations.org, and reclassified the sites into the broader categories of “good” (USCRN ratings of 1 or 2) or “poor” exposure (USCRN ratings of 3, 4 or 5)".
The full relevant paragraph i partly qoted before reads:
"The two types of stations were then treated as separate sub-networks for calculating different estimates of the average annual CONUS maximum and minimum temperatures. Such estimates were calculated using both the unadjusted and adjusted (homogenized) monthly temperatures. Specifically, the unadjusted and adjusted monthly station values were converted to anomalies relative to the 1971–2000 station mean. The anomalies were then interpolated to the nodes of a 0.25° × 0.25° latitude–longitude grid using the method described by Willmott et al. [1985] -- separately for the good and poor exposure stations."
I might be wrong, but to me it looks like they repeated the full process for the two subsets separately. If it's correct, the mixing of good and poor stations is non-existent.
Riccardo
Riccardo: I could be wrong, but I think they homogenised all the stations first. (Or, just took those values off the shelf, as it's already been done). It's the gridding and then spatial means that were done separately for each subset.
Hence the reason for the section I cite, which compares unadjusted, TOB-adjusted, and fully adjusted. As well as the statement, "provides evidence that a positive bias has not simply been transferred from poorly sited stations to well sited stations during the pairwise adjustment procedures."
Of course, none of that matters for the unadjusted means, which are anyway are counter to Watt's thesis.
Boris said it in the last discussion, and I'm seeing more signs of it coming.
They're going to say all the 'good' stations are infested by UHI of some sort, and thus rule out all the stations anyway. Then they'll go back and harp on specific microsite influences that are on average removed by the homogenisation, but they'll never admit that. Too bad the CRN is in their way, as well as all sorts of previous papers showing that UHI is pretty much taken care of.
Carrot Eater, Eli meant assumed in the sense of having previous work available to justify the assumption. BTW, there is a paper buried on Eli's desktop (a clean desktop is the sign of an empty mind) that shows that in the winter the distance at which sites are correlated is substantially less than in the summer. In that way the GISS model could be improved, assuming, of course, that Eli ever finds that damn paper.
" Indeed, the Menne paper ... does exactly that showing that not only are the temperature anomalies from the best and worst USHCN stations identical, but that they also overlay those of the USCRN."
I've been making this point on every thread regarding Menne I've participated in - the agreement with USCRN alone shows that there's no problem (not that all the other work done is meaningless, not at all, it's just that IMO agreement with USCRN is the end of the story).
My prediction is that the Watts crowd will insist that the USCRN has too few stations to give a meaningful US temp product, since in their mind if thousands of stations can't be right, how the heck can 110 be right?
dphgaza,
i know they don't read the litterature, but Vose and Menne (JoC 2004, 17, 2961) showed that the coeficient of determination can be as high as 95% already with 25 stations (cfr. fig. 7).
Riccardo
Eli, I know what you meant; just saying that a reader may not realise it.
dhogaza: Hopefully the reviewers won't let them ignore the USCRN. Or let them get away with not calculating spatial means. They'll really really want to avoid doing that.
This bunny doesn't seem to have an online subscription for Willmott (1985). Anyone know if there's a copy lying around somewhere? I have a handle on how GISS does its gridding, but don't know much abut NCDC or CRU.
Hi rabbets.
Just spent an unpleasant few hours over at Christopher Booker's Telegraph blogs. As big a group of bigoted, uneducated, ideologically driven people that you will find. One favourably quoted 'Dr Richard Courtney' and I remembered your post from back when. It was useful!
So, knowing some denialists and conservative-types are so quick to trot out the "argument from authority" trope when they have nothing to go on, what would Markey Mouse's penchant for arguing from LowWatt or CA? "Argument from non-authority?
Best,
D
It's called copying and pasting stuff that you hope makes some sort of point in your favor. The cheerleader copy/paste.
It would be interesting to know MarkeyMouse's IP addy - I've been keeping track of where the cut/paste folk come from who visit my site, and I'm starting to see some interesting patterns.
I'd suggest a slight change in wording:
"CRN ratings as applied by surfacestations.org do not contribute a great deal to yearly average temperature anomalies."
Which is what you would expect.
It seems obvious that if you compare thermometers in urban versus rural settings, you'd see a big (DC) shift in temperature.
MarkeyMouse says. Eli, I post excerpts from Watts cos it seems to me you are relying on the casual reader not following your link, and relying on your untrue interpretation and biased selection.
Watts case is straight forward. The 90% of temperature stations which are unreliable are used to adulterate by cross reference the very small number of reliable temperature stations.
The two sets of by now unreliable data are now compared and found to be equally adulterated.
The whole paper from Menne is stupid.
What is revealing is your haste to make something of an incomplete data set by using faulty methodology. You realise that when Watts is proved correct, the whole North American data set will have to be thrown away, and with that will go any vestige of warming.
MarkeyMouse says:
It's stupid to pretend the Urban Heat Island effect doesn't exist. See http://wattsupwiththat.com/2010/01/31/uhi-is-alive-and-well/
Markey: You can't read or contribute original thought, can you. We've said multiple times that Watt's argument about cross-contamination does not hold any water whatsoever. Menne anticipated the argument, and specifically provided the data to reject it. And on top of everything, you've got the CRN to deal with. Read the f'ing paper and think about it, instead of running to Watts for instructions on what to say.
As for UHI, nobody says it doesn't exist. The question is to what extent it contaminates the overall record. By pretty much any quantitative analysis, the answer is not much.
MarkeyMouse says: It's all over for you Carrots. http://www.climatedepot.com/
You have probably missed the opportunity to exit the sinking AGW ship gracefully, but you can still minimise your losses.
At least you have avoided prosecution. http://www.telegraph.co.uk/comment/columnists/christopherbooker/7113552/Climategate-confusion-over-the-law-in-email-case.html
But being a laughing stock and Professor is not a comfortable combination.
Markey: Continue randomly posting links, without thinking, if you wish.
It's funny that Watts chose to highlight Reno NV for his story about UHI. For some reason, he didn't choose to show the adjusted data at Reno. Look at Figure 8 in Menne et al, 2009, BAMS 90, 993-1007.
In short, the NOAA knows that station has a spurious trend due to urban warming, and it's corrected for, and it doesn't affect the overall numbers.
Climategate: time for the tumbrils
http://blogs.telegraph.co.uk/news/jamesdelingpole/100024416/climategate-time-for-the-tumbrils/
Post a Comment