
It's not a bug it's a feature
Conner in the comments asks about what some people, not me, Eli hastens to add, would call a Plimer
"The raw data from Mauna Loa is 'edited' by an operator who deletes what is considered poor data. Some 82% of the raw data is "edited" leaving just 18% of the raw data measurements for statistical analysis. With such savage editing of raw data, whatever trend one wants can be shown."and inquires WTF (sort of the right tude for WUWT).
Eli and Rattus Norvegicus try to be helpful, but after Capital Climate shows that this has become a rich source of denial delight, Ethon, who was getting quite hungry, decided to fly over to the Mauna Loa Observatory (MLO) and check it out. Ethon is quite fond of high aeries even if they are on scenic Pacific Islands and you have to burn a lot of liver to get there, but he does like to check it out before he goes, and lo, the big bird found a nice intro from a high school student who spent time doing science in 1994, Eleanor Foltz, who, some people, not Eli, he hastens to add, would say obviously knows more about the subject than Ian Plimer
It is well known that MLO nighttime downslope winds and daytime upslope winds do not relate well to free tropospheric wind flow in the region of the Mauna Loa massive. The regular downslope winds bring nocturnal upper level air to the observatory site that allows MLO to make background atmospheric composition measurements most days of the year.
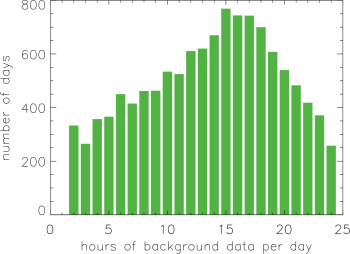 While measurement of the CO2 mixing ratio in the free troposphere is possible almost every day at MLO, one has to monitor the winds and other conditions to be sure that it is being measured. The figure to the left shows the number of days during which measurements could be made for a given number of hours. In any particular hour, not every measurement is accepted for a variety of reasons. This being the government, there is a web page which actually even a bird can find. Now, some people, not me, Eli hastens to add, might believe Ian Plimer's research was slipshod. The NOAA web page carefully explains how measurements are made and how and why readings are accepted or rejected. In addition to the meteorology (wind direction and such) this includes
- The standard deviation of minute to minute averages should be less than 0.30 ppm within a given hour.
- The hourly average should differ from the preceding hour by less than 0.25 ppm.
- In keeping with the requirement that CO2 in background air should be steady, we apply a general “outlier rejection” step, in which we fit a curve to the preliminary daily means for each day calculated from the hours surviving step 1 and 2, and not including times with upslope winds. Aell hourly averages that are further than two standard deviations, calculated for evry day, away from the fitted curve ("outliers") are rejected. This step is iterated until no more rejections occur.
Anyone who wants to look at the hourly data since 1974 is welcome. Stuff they toss is flagged.
Comments


24 comments:
Wow, thanks Eli! You have made this little bunny very, very happy!
And, may I ask, do I have permission to reproduce this post on another forum?
I wonder what nutty thing the crazies will come up with next? Based on past practice, it will certainly have to fit the "It's a giant conspiracy" framework.
Keep in mind though that these folks are really and truly a small minority now. Sanity is winning. You just don't hear from the sane folks as much!
Pieter Tan is very clever with his CO2 but is still unable himself either to measure temperature at Mauna Slope Observatory or get his NOAA colleagues to do so with any regularity (no valid annual means since 1992). This striking lack of scientific curiosity has not extended to the folk at down mountain Hilo who have managed to keep up records since 1905. Alas! since the 1959 CO2 annual data began up mountain, there has been ZILCH coorleation betweein either the annual means of Temps and the [CO2] or between the annual year on year changes in mean temps and mean [CO2], with R2 of 0.003, and the coefficient on d[CO2]/dt actually negative albeit not significant, with t-stat less than -1.0. Were did get its 95% certainty of at least an R2 of >0.5 and a >95% certainty of a significant positive CO2 coefficient?
Yes Tim, We know.
Do they record any sky-high readings during Mauna Loa eruptions?
It is certainly interesting to note that Eli and his mates cannot find a single Met station where there is ANY correlation at all between changes in annual Mean (Min or Max) Temperature and the rising level of atmospheric concentration of CO2 (i.e. [CO2]).
In any other scientific discipline that would mean the end of the hypothesis that rising [CO2] causes (with 95% certainty, a la IPCC AR4, rising GMT.
In this case, I predict with 100% certainty that Eli and his mate Jim Hansen will proceed to expunge all of GISS' individual station records whilst retaining Jim's unique GISS GMT record based already on nothing more than what Jim deems necessary to maintain his fictional AGW.
That is not to say there is no AGW. There is. But it results only from humans' energy usage. Obama and his henchmen like Holdren and Chu will therefore see no reason not to pursue reduction of such usage, even though logically it entails terminating all renewable energy and CCS schemes.
That is because, given that it is energy usage that causes whatever observable GW there may be, it matters not a jot what the source of that energy may be, whether renewable or fossil fuel. Whichever, there will be some warming from energy usage, like it or not. Many Greens already sense this, hence their (and Eli's) implacable opposition to any form of energy usage (including nuclear).
Tim, your theory is funny. So, it's the energy use that warms, not the GHG? Where did you get that from?
Tim Curtin claims That is not to say there is no AGW. There is. But it results only from humans' energy usage.
Well, that is a novel theory.
Let's see:
from wikipedia:
In 2005, total worldwide energy consumption was 500 exajoules (5×10^20 J) with 80 to 90 percent derived from the combustion of fossil fuels.[1] This is equivalent to an average energy consumption rate of 16 terawatts (1.585×10^13 W).[ie. 16 trillion watts]
Spread over the earth's surface ( 510,072,000 km² = 510 trillion m^2) gives the human energy use per square meter of about 16/510 W yr m-2 (ie, per m^2)
effective planetary heat capacity (Schwartz) is about 17± 7 W yr m-2 K-1.
So, the energy used by humans in one year would be expected to raise the earth's surface temp by about 1/500 degree Kelvin.(0.002K)
Even if energy use over each of the past 50 years had been as great as it was in 2005, over the past 50 years, the temp increase due to this effect would still have been expected to have been only about 1/10 degree (0.1K)
Total world energy use actually went up by a factor of about 3 from 1955- 2005, so to get a better picture of how much energy use over that period might have raised global temperature, we should really multiply our 1/10 degree K by a factor of about 0.7 giving about 7/100 degree.
What was the actual (measured) global temperature increase over that 50 year period (based on trend)? About 0.6K, or more than 6 times (9x if you take the 0.7 factor into account) as much as that expected by Curtin Theory (TM)
Energy use has continued to increase by a small amount since 2005 and there is uncertainty on the heat capacity given by Schwartz of course, but the difference is simply not enough to bring the expected temp change under Tim Curtin's (brilliant) "theory" into line with the observed temp change over that 50 year period.
Those poor AGW conspirator/scientist. Look at all the stations word wide where CO2 is measured:
http://www.esrl.noaa.gov/gmd/ccgg/iadv/
Its a lot of data to tweak.
Pick any station and the trend is the same. Seasonal cycle amplitude varies, which only goes to show the cunning of said conspirators.
Cheers, Ursus maritimus
Anonymous (8:18 AM),
Chaisson (EOS, 8 July 2008, pp 253-254) estimated that it would take about 300 years to cause a 3°C rise in temperature from direct heating caused by energy use (no CO2 effect).
Chaisson (EOS, 8 July 2008, pp 253-254) estimated that it would take about 300 years to cause a 3°C rise in temperature from direct heating caused by energy use (no CO2 effect).
"
Really?
3C/300 years = 0.01C/yr or about half the estimated yearly increase due to CO2 over the last 3 decades (~ 0.017C/yr).
Can that really be correct?
I'd be curious what Chaisson used for a heat capacity. It would have to differ quite significantly from the one given by Schwartz. using Schwartz' value, one would expect it to take about 1500 years to raise the global temp by the same 3C.
or about a factor of 5 greater time.
Anon,
Chaisson's estimates take into account future population growth and energy usage increases from economic development, so they can't be back-compared to previous or current rates. The bottom line: Yes, direct heating may be a factor in future centuries, but clearly not now.
It just occurred to me that that future groth in energy use was probably the reason Chaisson got the higher value.
you beat me to it.
i used todays energy use to get the 1500 year estimate for the same 3C change, but that's not reasonable.
But you are correct that one can not use the Chaisson estimate (deg C/yr) to figure out what the temperature rise over the past 50 (or 100) years was. (which Curtin was essentially claiming to be of the order of what has been measured)
for that, one has to use the actual energy use and I think my above estimate is probably in the right ball park.
FWIW google Dyson Sphere (yes, that Dyson)
Chuck,
No, it actually is surprisingly small. There is a ~2000 paper by Steve Ryan on this. You can clearly see the bump in the data tho.
TC response, 14 Oct 2009 1750 pm
My thanks to all for their thoughtful and interesting contributions to my last on energy use as the main source of whatever “global” warming there may be.
But to Anon. in particular I have to point out a major error in your otherwise correct computations as well as a major gap.
First, the error. The world’s energy usage is not of course spread evenly across the globe, but is wholly dependent on the spatial distribution of the world’s population. That is heavily concentrated, with 51% of the total global population now living in towns and cities which do not extend to as much as 1% of the world’s surface area, with Australia’s 5 coastal cities accounting for probably 90% of its total domestic energy usage, and not much less of total usage, and not even 1/1000 of its land area. Thus Anon’s “human energy use per square meter of about 16/510 W yr m-2 (i.e., per m^2)” needs to be rewritten as 1600/510 W/m^2 for say USA, and more for Australia.
Moreover it so happens that despite Hansen’s best efforts, most weather stations worldwide are in or around towns and cities and their airports (virtually 100% in Australia). Even the South Pole itself is not a human energy-free weather measuring site, with a permanent population of a hundred or two “scientists” not counting their cooks and laundry men, and growing fast, with Hercules delivering tons of building materials at a staggering daily rate, including for the proposed all weather 747 landing strip to bring in tourists in their myriads.
The major gap is Anon’s failure to mention that while IPCC AR4 WG1 p.141 puts the “Radiative Forcing” (sic – it is a meaningless concept without a shred of empirical validation) of [CO2] at 1.6 W/sq.m in 2005, the actual solar radiation in Australia for example averaged between 350 (Tasmania) and 650 (Port Hedland, W. Australia) milliWatt-hours per sq. cm between January 1968 and May 1974 (source, BoM, Australia, March 1975).
Now I am no expert at the metric system, I was taught and still prefer the Imperial, so correct me if I am wrong, but if I am right, solar radiation of 650 mmWh per sq.cm equates to 6,500 WattHours per sq. metre, rather more than the IPCC’s 1.6. No wonder the IPCC keeps very quite about solar radiation, since even a tiny change in that swamps the Anthropogenic 1.6 W/sq.m. per annum. What a surprise, the sun has some impact on the climate.
Tim Curtin claims "First, the error. The world’s energy usage is not of course spread evenly across the globe, but is wholly dependent on the spatial distribution of the world’s population."
The error is Curtin's (and curtains)
There are two problems with Curtin's approach. First, it assumes there is no energy redistribution -- ie, that if the air temperature near a power plant or in my kitchen goes up, the heat all stays in that one spot. Now, I know denialists love to say the greenhouse effect "violates the second law of thermodynamics", but the latter assumption about no energy redistribution actually would violate that law.
But, there is also another eentsy weentsy problem.
For kicks let's assume the latter assumption is correct and that Curtin's 100X multiplier is right
(indicated by his above statement: Anon’s “human energy use per square meter of about 16/510 W yr m-2 (i.e., per m^2)” needs to be rewritten as 1600/510 W/m^2 for say USA, and more for Australia).
For the actual energy use over the past 50 years, Curtin's 1600/510 W/m^2 would mean the temperature over that 1% of the earth's surface (where the energy was used) would have gone up by about 7C (ie 7/100 C x 100 see above for where my 7/100 estimate came from)
Wow! Is it getting hot in here or is it just me?
Let's ignore for the moment that not even isolated locations on the earth have experienced a 7C (!) rise in temperature over the past 50 years (yikes!), but let's take that to be true, nonetheless.
We are still not done (except perhaps in the cooking sense if the 7C increase is correct)
We still have to calculate how much that 7C rise over 1% of the earth's surface would have impacted the global average temperature.
Let's see, under Curtin Theory (TM)(thankfully for the Nobel committee, the details are being filled in with each new post), 99% of the earth's surface experienced no temperature increase at all and the other 1% experienced a 7C increase over the last 50 years.
So, what's our new global average?
.99(277 + 0) + .01 (277 + 7) = 277.07K
(assuming that every point started at about 277K)
or, the global average would have increased by about 0.07C
Funny, that's the same result as given in my first post above (7/100 degree C)
Should we be surprised?
As they say, it all averages out in the end. :)
Eh, there was this Swedish professor -- Magnus W would know. Elakhet och oförstånd. Tim, sure you're not on the wrong website?
Anon: you are again wrong on two counts.
He said, “there are two problems with [my] approach. First, it assumes there is no energy redistribution -- i.e., that if the air temperature near a power plant or in my kitchen goes up, the heat all stays in that one spot”. I never said that nor is it what I meant. Of course there is energy redistribution, which is what makes siting of temperature measurement so difficult, as the manifest failures of NOAA in that regard show. And that is why Anon’s second point, which assumes that the heating effect of energy usage IS confined to where the energy is used, is incorrect.
The proof of the pudding is in the eating (or heating?!), namely the regression analysis that is beyond the capability of Susan Solomon et omnes of AR4. I found some data on electricity production in the LA area (not easy) from 1990 to 2007, and regressed dT/dt on dkWh/dt and d [CO2]/dt. Although the outcome is not stat.sig. (too many omitted variables?) it was not without interest, as the coefficient on CO2 is actually negative, while that on kWh is positive.
Anon., please move on from simplistic math to stats, and show me your regressions that are consistent with [CO2] being the “predominant” influence on temperature anywhere on earth.
Anon., please move on from simplistic math to stats
Simple math is not without merit, especially when it unmasks bullshit masquerading as "science".
Anon, you have provided the perfect description of the IPCC and its AR4, it is ineeded b.s. masquarading as scinece, as with its headlines in the SPM and in chap.9 using the language of regression analysis ("95% certainty" etc) without having done any.
Where's your own? Regressions are simply applied math, are you up to it?
Hmm, first, Curtin claimed my initial post above was in error because I assumed (for my estimate of the global temperature increase due to energy use) that the total energy used by humans over the past 50 years had been distributed over the surface of the earth.
So, to humor him, I recalculated things assuming the concentrated energy use implied with his statement: 'Anon’s “human energy use per square meter of about 16/510 W yr m-2 (i.e., per m^2)” needs to be rewritten as 1600/510 W/m^2 for say USA, and more for Australia).
And now Curtin claims that that is ALSO wrong.
Curtin can't have it both ways. Either the energy has been distributed or it has not.
But if both assumptions (distributed and not distributed) yield essentially the same answer, that tells you something (or at least it tells logical people something)
That Curtin's statement is suspect: "That is not to say there is no AGW. There is. But it results only from humans' energy usage" -- and highly suspect, given the magnitude of the calculated temperature increase for the past 50 years based on the total energy use: of order 0.1 deg C, which should be compared to the measure increase of about 0.6C for the same period.
Curtin is simply trying (desperately) above to dismiss the issue with his "simplistic math" statement.
The fact is, simple energy balance calculations are certainly sufficient in many (if not most) cases to give order of magnitude estimates and separate the wheat from the chaff with regard to statements such as Curtin has made.
Enrico Fermi once used one such simple method -- throwing confetti up into the air and seeing how far away it landed -- to estimate the total energy of the first atomic blast.
That Curtin would characterize (essentially denigrate) "simple" math as "simplistic" indicates that he does not understand the power (ie, validity) of such methods.
Anon, I suspect we agree on many things, not least Enrico Fermi's Comment. But I do not accept that energy usage should be deemed to be "distributed" equally per sq. metre of the globe, palpably unlike [CO2] which clearly is so distributed.
I am (imperfectly) an empiricist. I tend to find - but not always - that local energy usage correlates better with local temperature changes than [CO2] at that location. More often I find that changes in solar radiation at any location (e.g Barrow, Ak, or Sacramento, Ca) correlate remarkably well with observed temp. changes at such locations, and not at all with changes in the alleged radiative forcing of [CO2].
The IPCC claims (passim) that solar radiation and changes therein are of no account, in fact it is even stated that either there are no changes in solar radiation, or if there are, they are of no account.
Yet the IPCC's claimed "Radiative Forcing" from rising [CO2] is only now at around 1.7 Watts per sq. metre p.a., while Solar Radiation at even Pt Barrow actually FELL from 2006 in January 1960 to 1505 Wh/sq.metre in January 2005.
Anon, can you explain to me why quite big changes in a large number (SR) as at Pt Barrow are as nothing compared with small changes in a tiny number (0.4% p.a. in 389 parts per MILLION of
CO2)?
Post a Comment