
Singing a different tune....
About a week ago, before the work tsumani hit, Eli posted on an EOS article by Shaopeng Huang in which it was shown that global warming has pushed a few zetajoules underground. (RTFR, this is the Rabett's blog and he will be obscure if he wants to.)
Today, as a by blow in Gavin Schmidt's deconstruction of Monckton's folly Grant dragged Huang in. It seems that Monkton used a figure from a 1997 study of Huang's, but here it is useful to compare some figures, the first being from Huang, Pollack and Shen, GRL 24 (1997) 1947 and this (below) is what we see in Monckton's magnum crocus
a blow up of the the small peak on the right of Huang, Pollacks and Shen's figure. Note that the three curves are for Baysean inversions with different priors, the null being that there is no climate signal. RTFR Before going on to deconstruct the this and that, we pause to look at the 500 year reconstruction published by the gang of Pollack, Huang and Shen in Science 282 (1998) 789: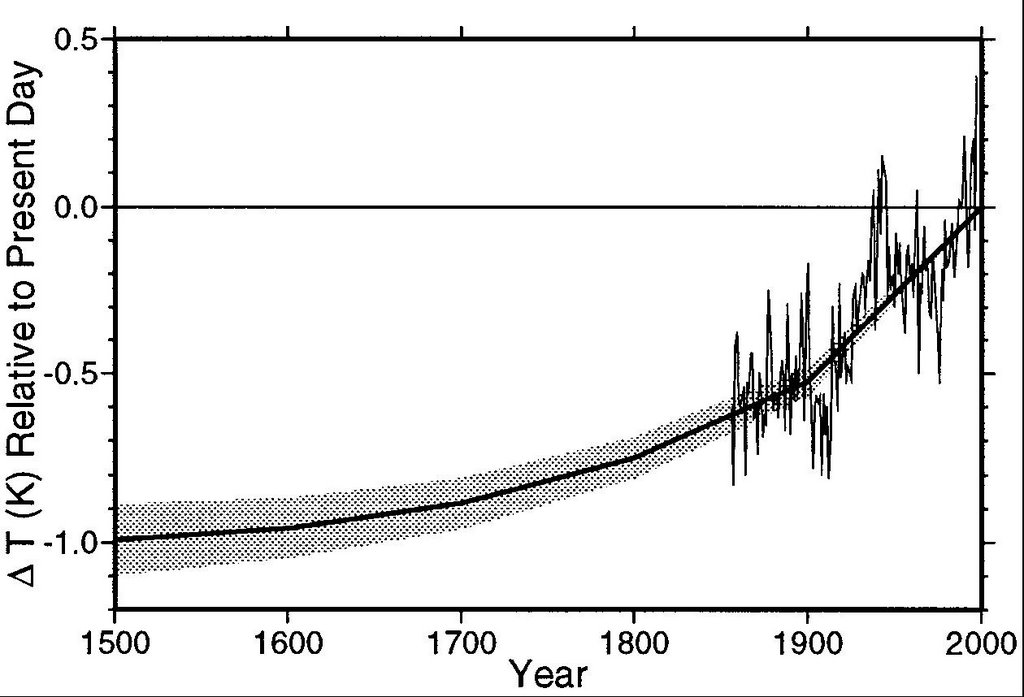 Observant numerates might notice that the two figures are "not in agreement"TM . The reconstruction immediately above was one of a series of very similar reconstruction published by the same group, the latest of which appeared in GRL 31 (2004) L13205.
 FWIW, the slope of the curve appears to be heading deeper at 1500 in the newer work. Huang's borehole reconstructions imply very large climate sensitivity, much larger than other reconstructions and larger that other model and observational estimates
Huang, Pollack and Shen (1997) held that
These surface temperature histroies shown in Figure 2 (ed: the first figure in this post) indicate a long-term warming from the colder conditions of the last glacial epoch of the late Pleistocene, peaking at temperatures above present-day in the interval 4000-8000 years ago. For several thousand years in the early Holocene the temperature averaged some 0.2 - 0.6 K above present day. Following this warm interval a cooling ensued in which the temperature dropped to near or below present day, reaching a minimum in the interval 1,300-1600 years before present. A warming follwed, yielding temperatures that averaged 0.1-0.5 K above present day in the interval 500-1000 years ago. From the peak of this warm period some 700-800 years ago, the temperature declined until about 200 years ago, reaching a minimum of about 0.2 to 0.7 K below present day, at which time a warming commenced that continues to the present.Their published 1500-2000 borehole temperature reconstructions are absolutely incompatible with this scenerio, what is more, they are also in disagreement with the various bent, broken or distorted hockey sticks. Mann, Rutherford, Bradley, Hughes and Keimeg took this on in 2003, (for those without access see comments in EOS I and EOS II
 from which we got this mother of all spaghetti graphs.) The Huang, Pollack reconstruction lies below almost all the others earlier that 1800). MRBHK pointed out that the borehole data could be falsified by landcover changes, e.g., snow, soil humidity, etc. and reconciled the borehole data with the other proxy reconstructions. (RTFR if you really want to know).
At a minimum one of the two thoughts in Huang and Pollacks minds is wrong, and maybe both.


5 comments:
But doesn't that just mean they abandoned the earlier one? Of course it also means that Monckton committed a double fraud, which I suppose is your main point. I haven't looked, but did the subsequent papers make any reference to the '97 paper? If so, what Monckton did becomes egregious indeed.
Well, my heart would kinda would like to say no, but Huang and Pollack sang the same song of the Holocene in Ann. Rev. Earth Planet Sci. 2000 28:339-65 pg 16. They managed to get both thoughts on the same page:
"Taken as a global ensemble, the borehole data indicate a temperature increase over the past 5 centuries of about 1 K, half of which has occurred in the twentieth century alone (Figure 7). This estimate of twentieth century warming is similar in trend to the instrumental record of surface warming determined from meteorological stations (Jones et al 1999b). When this trend is added to the more gradual warming in the previous centuries, the twentieth century stands out as the warmest century of the past five, a result similar to many recent multi-proxy reconstructions (Overpeck et al 1997; Jones et al 1998; Mann et al 1998, 1999) that did not include any geothermal component.
On a longer timescale embracing all of the Holocene, Huang et al (1997) used the global heat flow database (Pollack et al 1993) to establish a composite profile of heat flow versus depth to 2 km beneath the surface. The inversion of this profile revealed a long mid-Holocene warm interval some 0.2–0.6 K above present day temperatures, and another similar but shorter warm interval 500–1,000 years ago. Temperatures then cooled to a minimum of approximately 0.5 K below present, about 200 years ago."
Genius is not the ability to hold two contradictory thoughts in one mind at the same time.
The first paragraph says that the present century is the warmes of the past 5 (1500-2000). The second paragraph says that temperature during two periods prior to 1500 was warming than present century. Where is the contradiction?
Righto. Neither is genius the ability to perceive a contradiction where none exists, or to dwell on the trivial to the exclusion of the pertinent. A few valid formulae do not validate junk science. --AGF
Well, the conversation is 5 years old, but for completeness, Huang, Pollack & Shen address the 1997 and 2000 studies in a more recent paper (2008).
"The initial purpose of the present paper is to clarify and resolve this apparent change of perspective in our work between HPS97 and HPS00. Although science certainly allows for abandoning earlier results in favor of later results, in our case there is a different explanation. The fundamental difference between HPS97 and HPS00 is that they do not analyze the same data. Below we describe their respective datasets, and show why the results of HPS97 cannot be used for comparing MWP warmth to the 20th century."
Specifically on the 97 paper:
"The consequence of excluding the upper 100 meters is that the 20,000 year reconstructions in HPS97 contain virtually no information about the 20th century. As the authors of HPS97 we can be criticized for not stating explicitly in the abstract and figure caption that the ‘present’ (the zero on the time axis) really represents something like the end of the 19th century, rather than the end of the 20th century. At the time we published that paper our focus was on trying to extract a broad-brush representation of Late Quaternary surface temperature variability that might be overprinted on the ensemble of world-wide continental heat flux measurements. We did not anticipate that a comparison of late 20th century and Medieval Warm Period temperatures would later become a contentious issue."
Huang, Pollack & Shen (2008)
barry
Post a Comment