Firing the Auditors

Firing the auditors
Somewhere between a week ago and forever (my how things fly on the INTERTUBES) the following appeared at Climate Audit
UPDATE 1/24 Some additional comments on this data
to (UPDATE CA quotes now in italic)

defend Pat Michaels' congressional testimony where Scenarios B and C were erased
[Update: Jan 17 6 pm] To clarify, I do not agree that it was appropriate for Michaels not to have illustrated Scenarios B or C, nor did I say that in this post. These scenarios should have been shown, as I’ve done in all my posts here.Strike that one
- because
Hansen in his 1988 paper only mentioned that Scenario B was the most likely in an aside. The exact quote from CA is
"Despite the graphic precedence to Scenario A in the right panel graph, Hansen mentioned in the running text (9345):However, disapproving bunnies that we are, we RTFR and not the audit committee (mis) take on the paper:Scenario A, since it is exponential must eventually be on the high side of reality in view of finite resource constraints, even though the growth of emissions (`1.5% per year) is less than the rate typical of the past century (~4% per year).
and, then inconsistently with the graphic shown on the right side only showing Scenario A out to 2050, said (p 9345) that Scenario B was “more plausible”, an aside that subsequently assumed considerable significance."
The range of climate forcings covered by the three scenerios is further increased by the fact that scenario A includes the effect of several hypothetical or curdely estimated trace gas trends (ozone, stratospheric water vapor and minor chlorine and fluorine compounds) which are not included in scenarios B and C.The "graphic" that CA points to appears two pages later and there is no mention in the text of why scenario A was run out to 2050, while the others were truncated earlier (lack of computer time suggests itself but that is much less dramatic)
These scenarios are designed to yield sensitivity experiments for a broad range of future greenhouse forcings. Scenario A, since it is exponential, must eventually be on the high side of reality in view of finite resource constraints and environmental concerns even though the growth of emissions in scenario A (~1.5%/yr) is less than the rate typical of the past century (~4%/yr). Scenario C is a more drastic curtailment of emissions than has generally been imagined. It represents elimination of chlorofluorocarbon (CFC) emissions by 2000 [CHECK], and reduction of CO2 [SADLY NO] and other trace gas emissions [CHECK] to a level such that the annual growth rates are zero (i.e. the sources just balance the sinks by the year 2000. Scenario B is perhaps the most plausible of the three.
Strike that one
- then that
Hansen never said Scenario B was the most likely in his 1988 testimony. CA has only the Senate testimony, but look at the splendid dramatic claims
[Update: The testimony is now available and Hansen’s statement that Scenario B was “used” in his 1988 testimony is very misleading: Hansen’s oral testimony called Scenario A the “Business as Usual” scenario and mentioned Scenario B only in maps purportedly showing extraordinary projected warming in the SE USA(as mentioned by yr Humble Hare a year and a half ago, in his testimony to the House Energy and Power Subcommittee in 1988, Hansen said
For the future, it is difficult to predict reliably how trace gases will continue to change. In face, it would be useful to know the climatic consequences of althernative scenerios. So we have considered three scenarios for future trace gas growth, shown on the next viewgraph.Our auditor does not realize that Hansen testified on these issues TWICE in 1988, once to the Senate and once to the House. He should read Rabett Run. Of course both in his 1987 and 1989 testimonies he DID mention that scenario B was the most likely. Tout suite
Scenario A assumes the CO2 emissions will grow 1.5 percent per year and that CFC emissions will grow 3 percent per year. Scenerio B assumes constant future emissions. If populations increase, Scenerio B requires emissions per capita to decrease.
Scenario C has drastic cuts in emissions by the year 2000, with CFC emissions eliminated entirely and other trace gas emissions reduced to a level where they just balance their sinks.
These scenarios are designed specifically to cover a very broad range of cases. If I were forced to choose one of these as most plausible, I would say Scenario B. My guess is that the world is now probably following a course that will take it somewhere between A and B
Strike that one
- then that
since Scenario A was described as business as usual it had to be the most likelyor
Thus, I think it is appropriate to conclude that over the period to 2007, Scenario A is equivalent to what the IPCC calls its “no policy” scenarios, which mean business as usual without explicit policies implemented to limit emissions. When Hansen said “most plausible” he was factoring in factors such as limitations on fossil fuels and eventual emissions policies, which may certainly be the case over the longer term but have not interrupted BAU as yet.and somewhat lower down pjaco writes
Also, I am curious as to what appears to be your (willful?) misunderstanding of what BAU signifies. It is not, nor has it ever been, a stand in for predicted reality. It is, and always has been, a scenario of unchecked emissions growth not countered by regulation, significant volcanism, or economic restraint. Would you make the claim that BAU is the predicted reality still today- with so many governments and companies now cognizant of the issue and attempts to reduce emissions already taking place? If so, you will probably find yourself in a tiny minority, if not alone, in that interpretation.
but Eli simply points you to what Hansen et al said in their paper quoted aboveKyoto, Pinutabo, and the collapse of the Soviet Union with its resulting emissions decrease obviously most resemble B, and as Hugh and lucia say, it is perfectly reasonable to take Hansen at his word in choosing B rather than A as most likely.
These scenarios are designed to yield sensitivity experiments for a broad range of future greenhouse forcings. Scenario A, since it is exponential, must eventually be on the high side of reality in view of finite resource constraints and environmental concernswhich is what happened.
Strike that one.
- because
the Scenario A line was in red it was the most likely because that is what a rock jock would do(OTOH red could indicate hotter, or whatever)
- because
A was a solid line in the original it had to be the most likely(turns out it was finely dotted in the original which didn't reproduce well at low res. FWIW OTOH, A was a solid line in Fig. 2 showing the forcing scenarios so cry Audit and loose the drama queens of climate. Whatever, but
The audit committee gazed at all this and said it was good, but lo, something was as rotten as a drilled pine tree when compared to the actual data

Turns out that CA had used the infamous Eschenbach versions, read through a glass darkly and just wrong on lots of things. The auditors thought that Eschenbach had got it right and Gavin Schmidt, NASA Employee, who had the actual data which he freely shared was wrong. Much hilarity ensued (see Deltoid and links there to CA).
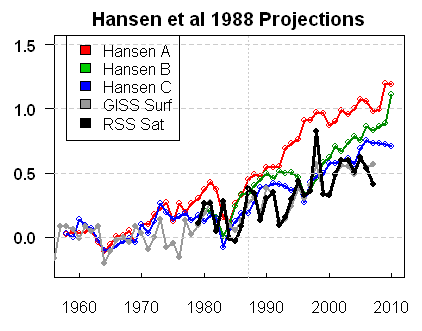
But lo, our auditors had also used an older version of the RSS microwave tropospheric temperature reconstruction. It had a serious error. What does the corrected version look like?
 There are minor differences in the other years which have not been entered. They fall within the width of the line. The biggie is 2007 which is substantially higher in the corrected version (Heavy red line. It must be important).
UPDATE: Terry of the comments points out that the RSS correction was posted 1/18, the CA post 1/16. What a spoil sport. There is a correction on CA. CA says that it was unfair to point this out as an error in the CA original post. Allow Eli a simple parsing, it was an error, it was not a culpable error. At the end of the day, the new reconstruction seriously weakens the argument that McIntyre was trying to make.
Oh yes, GISS Surf refers to the GISS surface stations + oceans data. GISS surface station data is shown in the figures immediately above
Of course, all this neglects the fact that the 1988 paper forecast the 1998 El Nino (just kidding folks)
The audit committee presented its bill. The bunnies used it for necessary functions.
What was the error?
We discovered an error in our processing of AMSU data from NOAA-15 for TLT. A new version, version 3.1 is now available and should be used for all applications. This new version is in much better agreement with other sources of tropospheric temperature. We apologize for any inconvenience.PPS: Lots of folk are falling into the RSS error trap. As the UAH series before this stuff is flypaper for denialists. See Deltoid, Motl and more
What was the error?
Last January, I made a small change in the way TLT is calculated that reduced the absolute Temperatures by 0.1K. But I only used the new method for 2007 (the error). When the data are merged with MSU, MSU and AMSU are forced to be as close as possible to each other over the 1999-2004 period of overlap. This caused the error to show up as a downward jump in January 2007. To fix the problem, I reprocessed the 1998-2006 AMSU data using the new code (like I should have done in the first place), and merged it with the MSU data.
We would like to thank John Christy and Roy Spencer, who were very helpful during the diagnosis process.
Carl Mears, RSS, January 16 2008


50 comments:
> we RTFR and not the audit committee
Should 'not' read 'note'? Thinkso.
Great post Eli. Nail, head, hit and all that.
PH
Excellent audit of the auditor, Eli.
Just one minor point.
To highlight just how inept (I'm giving him the benefit of the doubt) our most esteemed "auditor" (McIntyre) is, it might be best if you did the strike-throughs (and text, of course) in red.
It is important to point out that what you quote above is an AMENDED version of the McIntyre post, which originally stated
"Hansen has subsequently said that Scenario B was said by him at the time (in his testimony) to have been the "most plausible", although the article itself contained no such statement."
McIntyre omitted the false text (bolded above) and replaced it with
"then inconsistently with the graphic shown on the right side only showing Scenario A out to 2050, said (p 9345) that Scenario B was “more plausible”, an aside that subsequently assumed considerable significance."
After the replacement (like all good auditors) McIntyre left no trace of the original incorrect text.
"After the replacement (like all good auditors) McIntyre left no trace of the original incorrect text." Hmmmm - send back for GLP training?
A familiar meme of the AGW credulists is that the UAH satellite temperature interpretation can't be trusted because of all the errors that have been caught and corrected. Does the same now apply to the RSS interpretation?
- nanny_govt_sucks
Nanny, if you were to pay attention, you would know that RSS say the A/MSUs are a shaky proposition in terms of generating temp data since they weren't designed for such a thing. They only got into the business due to the necessity of "auditing" UAH. Speaking of which, shouldn't McSqueak be paying them royalties?
Eli,
Thought you might be interested to learn that I also had comments detailing GHG reductions in post-Soviet countries which were deleted apparently per Steve McI #141 despite other users' comments suffer no such fate.
That and attempting to question Tim Ball whether or not he still believed that CFCs didn't destroy atmospheric ozone was enough to have all of my comments now filtered as spam.
I appreciate you referencing my comment, as one never knows when something on Climate Audit can vanish with nary a whisper about it.
Cheers,
- pjaco
One plea for those who come along later -- those who don't follow this very closely will have trouble telling who said what when.
If possible, it's always good to put a cite directly after each block quote. Or a footnote marker there and cites below.
I know it isn't academic writing, but -- there's a good reason for teaching new readers how to figure out for themselves who said what and who's paraphrasing.
Tiresome, I know.
Nanny, Eli's consistent position has been that MSU measurements of climate are chancy because the instrument was never designed for that purpose, the AMSU being better (although one of the detectors appears to be going south) and that Spencer and Christy pulled off something nice. However, the analysis was always difficult and subject to problems.
Way to focus on a petty and inconsequential triviality, which you distort, and miss the actual point.
Even with the current RSS data set all of Hansen's predictions are currently higher than reality, even scenario C which assumed diminishing anthropogenic CO2 emisiions which clearly han't happened.
All except scenario C, which only dipped to or below actual temperature data a few times in the period, Hansen's "scenarios" have been too high since 1999.
Steve McI says the "older version" of RSS was current as of the time he made the chart.
Lance, the actual forcing has been in between scenario B and C. That and the fact that he was using a model which is now over twenty years old and had a sensitivty S of 4.2C vs. the current model which is around 2.5C and I don't see how one can really complain about the results. It seems as though the model is pretty useful.
@Glen,
McInctyre could'nt have plot data published by RSS on 18 Jan (see link below) in his 16 Jan posting. So Eli's rant is pointless rabbit's droppings.
http://www.remss.com/pub/msu/monthly_time_series/
@Norvegian rat,
I concur that Hansen's model is "pretty useful"... to his career. Without models, he would be forced to do true science or attend joblines.
Demesure.
ratboy,
The truth is no one knows the actual "sensitivity" so claiming that Hansen's hoary old models "would'a been a contenda'" if only... just reinforces how shaky the whole climate model biz really is.
Hey Rattus,
Models are a tool used day in and day out by every practitioner in every science, engineering discipline,and for that matter every other field of endeavour. There are many different kinds, of various degrees of complexity. Without models no-one can say anything about anything. Some models are mathematical descriptions, some are computational implementations of said mathematics, some are conceptual, others are intuitive. Heck without the complex set of models you hold in your head, describing the world as you understand it, you would be a non-functioning vegetable. To claim that someone using models is therefore not doing true science betrays your total lack of understanding of science or much else for that matter.
I enjoy reading your site and am learning a lot about climate change as a result, but I find this article difficult to follow. Perhaps it is the layout with the crossings-out and indents, but what exactly is your point? Maybe I am a bit thick, but I have read it three times and also gone back to the revised article on CA and re-read the comments there. I do not really understand how your comments have furthered the debate beyond what has been already discussed at CA. Could you perhaps summarise what you are getting at. I suspect that I am not the only reader who is a unsure.
How does bunny foot taste in bunny's mouth?
Steve M's original post 1/16/08
RSS update 1/18/08
Rabid Rabbett farting accusations all over the place serving only himself.
Sorry, but I find this amusing.
Jon P
What Martin said. What Lance said. And others.
What is the point of this post and discussions???
What Hank said. Put a who and when above each quote. (And who strikes through?) It's a bit hard to follow now.
"Perhaps it is the layout with the crossings-out and indents".
If McIntyre did not make so many mistakes, it would be a lot easier for others to follow -- much fewer strike-throughs.
Eli is simply behaving as a real auditor does -- providing a trail of the errors that were made by McIntyre at each stage.
In contrast, McIntyre apparently prefers to make changes and erase all trace of his mistakes.
Some auditor.
Is this maddening pile of indentations, strokes, and interruptions an elevator or a yo-yo?
Put the quotes from CA in italic, inc. the ones from Pielke and pjaco.
Hope that helps.
I like it that the chimp squad from CA has nothing better than to audit the indentations of Eli's text and projections like focus[ing] on a petty and inconsequential triviality, which you distort, and miss the actual point (pal, you're not supposed to cut/paste the strategy, you're supposed to harrumph loudly about a strawman).
Best,
D
Sorry, but this post is completely incomprehensible.
Eli:
It sounds like you have a golden opportunity to earn some credibility. It looks like you made a mistake claiming that McIntyre should have used the January 18th data in his January 16th post. A small apology on that point would go a long way toward establishing your decency. And remember, a half-hearted apology is a second insult.
To the folks from CA; You're right, which scenario Hansen thought most likely is totally irrelevant, Steve McIntyre put a great deal of effort into making grounds for A via the most tenuous of links (color of line), whilst missing Hansen explicitly stating B in multiple testimonies and the paper itself, second paragraph iirc. That is not 'auditing', which I believe, was the point of this post.
More sloppiness (the switch from forcings to relative concentrations back to... maybe, it's hard to tell... forcings again, apples and oranges)
"As to how Hansen’s model is faring, I need to do some more analysis. But it looks to me like forcings are coming in below even Scenario B projections. So I agree that it’s unfair for Hansen critics to compare Scenario A temperature results to actual outcomes as a test of the model mechanics. On the other hand, Hansen’s supporters have also been far too quick to claim vindication given the hodgepodge of GHG concentration results. If it’s unfair to blame the blame the model for differences between actual and projected if the GHG projections are wrong, then it i equally unfair to credit the model with “success” if it gets a “right” answer using wrong GHG projections. One would really have to re-run the 1988 model with observed GHG concentrations to make an assessment."
PS Demesure, GISS model II and model E source code are freely available online, make a name for yourself, publish your findings and show how those and 50 years of other research are non-science. Myself and Dano eagerly await your paper in the peer-reviewed literature, or failing that, in Energy & Environment.
The silly went on beyond Jan 18.
Once again, McIntyre has made a mountain out of a mole hill and succeeded in making himself foolish in the process with his false initial claim that "Hansen has subsequently said that Scenario B was said by him at the time (in his testimony) to have been the "most plausible", although the article itself contained no such statement." (a claim that he has since replaced)
McIntyre also said: "One would really have to re-run the 1988 model with observed GHG concentrations to make an assessment."
As Gavin Schmidt has pointed out, what matters is not the concentration (or even forcing) of individual GHG's, but total forcing and, as Schmidt also notedon real Climate
"the scenario closest to the observations is clearly Scenario B. The difference in scenario B compared to any of the variations is around 0.1 W/m2 - around a 10% overestimate (compared to > 50% overestimate for scenario A, and a > 25% underestimate for scenario C). The overestimate in B compared to the best estimate of the total forcings is more like 5%. Given the uncertainties in the observed forcings, this is about as good as can be reasonably expected."
The global mean temperature anomaly matchup between what actually occurred and both scenario's B and C for the same period is actually quite good. Scenario C temp change still matches fairly closely even though emissions were assumed to stop in 2000 because of thermal inertia: not all warming due to GHG's is immediately realized, so warming does not cease when emissions cease.
Dano refers to the 'chimp squad from CA'.
Should we perhaps all do this? Should we start referring to 'Dano the Chimp' in our posts? Would that really advance anyone's understanding or convince anyone?
Get a life, grow up. Learn how to debate issues. Sneering, schoolboy humour, childish insults, none of these advance the issue of understanding what is or isn't going on with the climate one bit, and that actually does matter.
All you can see is your own giant ego and your own idiotic desire to make some sort of personal point. Focus on the climate for Heaven's sake, that's what its about.
But I think its far more important to you guys to sneer at McIntyre than to actually debate and analyse any issues. Issues guys, stats, numbers, observations, facts. That is what counts. Whether M is right or wrong in what he said last week about Hansen, or Rabet in what he said last week about M, is trivial in comparison to what the facts are. Are you trying to be a forum for random sneering, or a forum for discussions of climate issues? Whichever the attempt, its a forum for sneering right now.
Poor McIntyre.
has to rely on anonymous defense.
Anon 2:56 said "But I think its far more important to you guys to sneer at McIntyre than to actually debate and analyse any issues"
What do you call the post immediately above yours if not an analysis of the science?
You are criticizing others for not debating the climate science, but YOU yourself are not doing that, instead accusing everyone of "making some sort of personal point."
So debate that post man! Debate the science.
Hansen 88 Scenario B was pretty damned close on the temperature change and pretty damned close on the total forcing which is what matters most.
Whether Hansen was off on his assumptions about this or that individual greenhouse gas concentration increase is irrelevant to whether his model was a decent one.
Hansen projected the increase for the main main greenhouse gas (CO2) pretty much dead nuts on and the overall forcing under scenario B assumptions was pretty close to what actually transpired -- and certainly much closer than to what was assumed for either scenario A OR C.
Something some people do not seem to get (or conveniently choose to ignore) is that climate modeling is NOT about predicting future emissions. Hansen is not a soothsayer who predicts how humans will emit CO2 in the future, though some would try to claim otherwise in order to discredit his 88 paper (and himself).
So, come on, debate, man!
Warning: I suggest you RTFP first. Otherwise you will simply make a fool of yourself. That is a not a "childish insult". It is a fact.
I like it that the chimp squad from CA has nothing better than to mischaracterize and hope for a turning back of the calendar to debate something that is over.
The world has moved on and is debating what to do, not whether man-made climate change is real. Sneering at poor rhetoric and childish, willful misunderstanding has been going on since the Greek demos.
Best,
D
Then let's talk about stats, I read this on CA about the RE stat and I confess to being a bit confused. How does...
a) a red-noise series starting at the beginning of a 17 point validation period with no points over a ~130 year training period, compare with
b) a model that starts on a training period 79 points distant from a 58 point validation period?
Not very much, is my guess. See, the way I'm thinking, the RE stat measures how well the model matches the data over the validation period compared to the mean of the data over the training period, now if the model starts at the end of the training period, beginning of the validation period, with the same value as the last point in the training data, it will match the following 17 points pretty well compared to the mean of trended training data which extends back 130 points previously, even if the model is just noise. But, would a model which is just noise do the same over a much longer 58 point validation period, especially if it starts 79 points distant in the training period? Is this why Mann et al found red noise gave an RE~0?
Seems iffy to me. But then, stats isn't my field.
The only legitimate way to assess Hansen's prediction is: did his forecasts adjusted for input accuracy meet the outcome?
He was presumably making conditional predictions about the relationship between a given variation in GHG and temperature.
So, very simple: if GHG did not rise as he expected, he's not wrong. If however GHG behaved differently than he had expected, and temperature behaved as he had expected, then he was wrong. What he needed to get right was the effect of a given level or rise in GHG, not the absolute level of temperature or the absolute level of GHGs.
Dano, at the moment, you do not belong in civilised society. You do not know how to conduct a conversation. Anonymous insults and playground name calling help no-one, least of all you. Get help, its nothing to be ashamed of, but it is to do something about. Meanwile, do please get out of the way so the grownups can talk in peace.
Anon1132
Anon 11:32 said" What he needed to get right was the effect of a given level or rise in GHG, not the absolute level of temperature or the absolute level of GHGs."
Which part of my above comment did you not understand?
"Hansen 88 Scenario B was pretty damned close on the temperature change and pretty damned close on the total forcing which is what matters most.
Whether Hansen was off on his assumptions about this or that individual greenhouse gas concentration increase is irrelevant to whether his model was a decent one.
Noone but you is talking about absolute temps or GHG concentrations.
You are really starting to make yourself look foolish here.
You are really starting to make yourself look foolish here.
That would be something of a feat, there's pretty strong competition on this site. Fortunately we are not holding competitions for immaturity, or it would be time to give up.
The bit I did not understand is this. I want to see the model rerun, but with the GHGs that we observe today, CO2 and others accounted for separately so we can verify they are accurate, and I want to see what it predicts in the way of temp. I don't want to see total forcings.
Should be pretty simple to do. Get the code, post the code, lets do it. Or have they done it?
anon1132
The code is posted at GISS. Enjoy yourself. Since the code is driven by the total ghg forcings the only thing that matters in the end is the total forcing. Stop being so CA like.
Remind me again what the point of all the focus on a 20 year old model is?
These models were never intended as the be-all and end-all. The Hansen 88 model was developed at a time when many people did not even believe the earth was warming.
There has been a great deal of research and model development since then and perhaps it would behoove Mc and friends to focus on that -- and publish their results in the peer -reviewed papers instead of whatever the hell it is they are trying to accomplish with their Hansen bashing.
If McIntyre and others believe that by disproving Hansen 88 they will be a shoe-in for the next Nobel Prize in Climate Science, I think they are in for a rather rude awakening.
First, the Nobel committee don't give one in that area and even if they did, I seriously doubt they would give it for simply showing that Hansen is not all-knowing like God.
Thanks, Eli, the italics for the material quoted from CA makes the original much easier to follow.
Speaking of Nobelists, this (from 3 years ago, but I had never seen it mentioned) is quite clear and good:
http://www.science.org.au/events/rowland/index.htm
----beginning---
PUBLIC LECTURE
The changing atmosphere in 2005
The Shine Dome, Canberra, 21 February 2005
Nobel Laureate Professor F. Sherwood Rowland
Donald Bren Research Professor of Chemistry and Earth System Science
University of California, Irvine
I first came to Australia about 20 years ago. The reason that I came here was a very simple one, that the atmosphere is shared by everybody but there is a northern hemisphere and a southern hemisphere, and the premier atmospheric group in the southern hemisphere is CSIRO, operating at Cape Grim in Tasmania and out of Melbourne. So it became very important to work together with the scientists here in Australia and that has continued, so that this is probably my seventh or eighth visit to Australia.
The starting point for my lecture is simply to point out that the concern about the atmosphere is not totally new. ....
----------------
Original: http://www.science.org.au/events/rowland/index.htm
After whipping himself with it, McIntyre is again throwing in the towel -- this time on Hansen 88.
McIntyre:
"One has to distinguish between Hansen’s abilities as a forecaster of future GHG concentrations and the skill of the model, with Hansen himself obviously placing more weight on his role as modeler than as a GHG forecaster. To the extent that “somewhere between A and B” represents Hansen’s GHG forecast, in that GHG increases appear to have been closer to B than “somewhere between A and B”, it is more reasonable to use B to assess the model performance. (It would be more reasonable still for NASA to re-run the 1988 model with observed results.)"
McIntyre also has this remark:
"one wonders how much subsequent controversy might have been avoided if Hansen et al had clearly shown and discussed the allocation between GHG in the clear form shown above."
No, what one really wonders is why people like McIntyre bother to comment before they even read the paper.
The "controversy" resulted because people like McIntyre made false claims about which scenario Hansen considered most plausible before they had any clue what Hansen's 88 paper was about.
Hansen NEVER claimed (or even implied) that he was a soothsayer who was certain of future greenhouse gas emissions. Quite to the contrary. He gave his best guess (scenario B) but made no bones about the fact that it was just that -- a guess. Hence the "bracketing" scenarios A and C.
Finally, the fact that McIntyre says this
"During our discussions of the differences between Hansen Scenarios A and B - during which the role of CFCs in Scenario A gradually became clearer - the absence of a graph clearly showing the allocation of radiative forcing between GHGs stood out rather starkly to me. When Gavin Schmidt re-visited the topic in May 2007, he only showed total forcing both in his graphic here (see below)and in the data set"
indicates that McIntyre still does not appreciate the fact that total forcing (and not the forcing due to of individual GHG's)is the critical thing with regard evaluating Hansen's model.
Hansen knows that. Gavin Schmidt knows that. Any climate scientists worth his/her salt knows that. Anyone with a clue who actually read Hansen's paper knows that.
McIntyre does not.
Well, I left the following comment on the blog of the author of "Niche Modelling" and the source for "Random numbers predict future temperatures", the author of the code and the claim repeated in the CA post above.
"What is the RE score over the ~130 point calibration period, the period for which the mean is calculated?
What if the calibration period is shortened to 79 points and validation increased from 11 to 58 points, as is done in MBH98, does then the model, in this case noise, give high RE scores over both periods?
Regards"
Appeared on the site at 9:01 pm, still there at 9:38 pm, deleted without trace by 12:10 pm.
See, anon @ 2:56, I'm trying to "debate" and "analyse" stats. Well, what do you think?
Sorry to be so off topic.
Screenshots, Lazar. alt+print screen>open Wurd>filename that you can figure out contents.
Best,
D
'fraid I didn't.
Why are screenshots good evidence? I would have thought forgery to be easy...
> screenshots
If you accumulate them, others may also, and you eventually get a clear pattern when enough people have looked at a blog and seen a posting show up and disappear, who will confirm they saw what your screenshot shows, I'd guess. If it's worth the trouble.
How is the blog related to the authors of that paper linked there?
http://www.aibs.org/bioscience-press-releases/070301_improved_predictions_of_warminginduced_extinctions_sought.html
I recall Botkin's piece being discussed months ago, perhaps just a pointer back to wherever that was rather than redoing that would be helpful if anyone recalls it. Or just wait a bit and see if it gets cited by other people in the next year or two, more to the point.
RE: "screenshots"
Perhaps someone (or more than one someone) should start a mirror site of Climate Audit to archive each post in its ORIGINAL (unamended) form -- you know, before mcIntyre starts backtracking (ie, track obliterating)
Call it the (I) "Take it Back Machine".
David Stockwell is the owner of the blog, and one of the 19 co-authors. Otherwise, pass. I see Craig Loehle on there too...
Ah, ok... it's diplaying comments to the submitting ip whilst holding them up for moderation, they disappear when the browser cache is cleared.
Hank Roberts, Anonymous 6:42 PM,
There is webcitation.org for all your immediate Intarwebs Tubes archival needs. (Well, almost all.)
To the folks from CA; You're right, which scenario Hansen thought most likely is totally irrelevant, Steve McIntyre put a great deal of effort into making grounds for A via the most tenuous of links (color of line), whilst missing Hansen explicitly stating B in multiple testimonies and the paper itself, second paragraph iirc. That is not 'auditing', which I believe, was the point of this post. More sloppiness (the switch from forcings to relative concentrations back to... maybe, it's hard to tell... forcings again, apples and oranges) "As to how Hansen’s model is faring, I need to do some more analysis. But it looks to me like forcings are coming in below even Scenario B projections. So I agree that it’s unfair for Hansen critics to compare Scenario A temperature results to actual outcomes as a test of the model mechanics. On the other hand, Hansen’s supporters have also been far too quick to claim vindication given the hodgepodge of GHG concentration results. If it’s unfair to blame the blame the model for differences between actual and projected if the GHG projections are wrong, then it i equally unfair to credit the model with “success” if it gets a “right” answer using wrong GHG projections. One would really have to re-run the 1988 model with observed GHG concentrations to make an assessment." PS Demesure, GISS model II and model E source code are freely available online, make a name for yourself, publish your findings and show how those and 50 years of other research are non-science. Myself and Dano eagerly await your paper in the peer-reviewed literature, or failing that, in Energy & Environment.
Post a Comment