Andy Dessler, an old friend of the blog, testified to the Senate Environmental and Public Works Committee yesterday, while the testimony is available in full at the EPW site, Eli, with Andy's approval, is reproducing it at Rabett Run, where comments are welcome. There is a general agreement that the testimony is a good statement of the current status of climate science and the challenges of climate change. Without further ado:
What we know about climate change
Andrew E. Dessler
Professor of Atmospheric Sciences
Texas A&M University
My name is Andrew Dessler and I am a professor of atmospheric sciences at Texas A&M University. I have been studying the atmosphere since 1988 and I have published in the peer-reviewed literature on climate change, including studies of the cloud and water vapor feedbacks and climate sensitivity.
In my testimony, I will review what I think are the most important conclusions the climate scientific community has reached in over two centuries of work. Let me begin by describing some important points that we know with high confidence — and how that has led me to personally conclude that climate change is a clear and present danger.
1. The climate is warming.
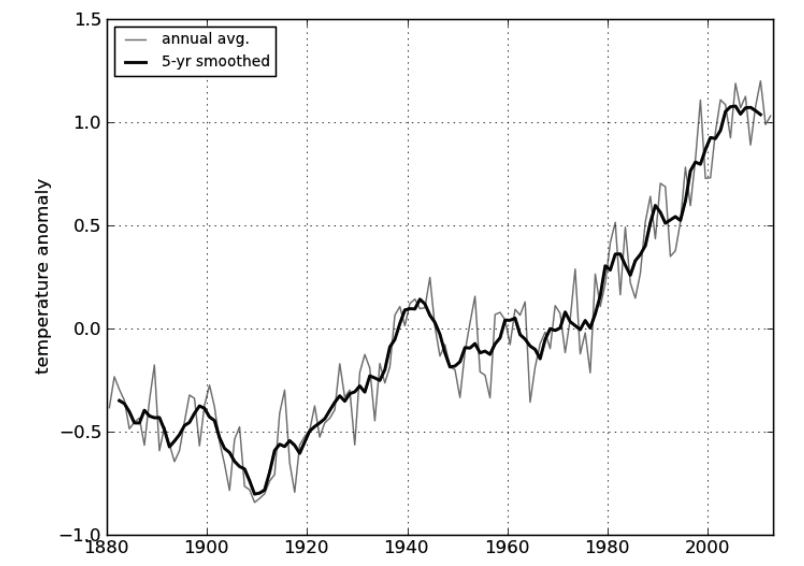
By this I mean by this that we are presently in the midst of an overall increase in the temperature of the lower atmosphere and ocean spanning many decades. This can be seen in Figure 1, which shows the global average surface temperature, and Figure 2, which shows the heat content of the ocean (both figures plot anomalies, expressed in degrees Fahrenheit). A mountain of ancillary data supports these observations of warming: e.g., satellite measurements of the temperature of the lower atmosphere, loss of ice on the planet, observations of sea level rise.
Fig. 1. Global annual average temperature anomaly in °F; the gray line is the annual average and the black line is a smoothed time series. Data are from the NASA GISS Surface Temperature Analysis [Hansen et al., 2010], downloaded from http://data.giss.nasa.gov/giste mp/. Other analyses show nearly identical results.
2. Most of the recent warming is extremely likely due to emissions of carbon dioxide and other greenhouse gases by human activities.This conclusion is based on several lines of evidence:
a. Humans have increased the amount of carbon dioxide in the atmosphere from 280 parts per million in 1750 to 400 parts per million today. Methane levels have more than doubled over this period, and chlorofluorocarbons did not exist in our atmosphere before humans.
b. The physics of the greenhouse effect is well understood, and it predicts that the increase in greenhouse gases will warm the climate.
Fig. 2. Ocean temperature anomaly in °F of the entire ocean. Anomalies are calculated relative to the 1970 - 2000 period (data are from Balmaseda et al. [2013]).
c. The actual amount of warming over the last century roughly matches what is predicted by the standard model1 of climate. This is shown in Fig. 3 .
1 Following particle physics and cosmology , I’ll refer to the mainstream theory of climate science as the standard model. A climate model is a single computational realization of the physics embodied in this standard model.
d. Reconstructions of paleoclimate data over the last 60 million years show that changes in atmospheric carbon dioxide exert a strong control on the climate system.
e. There is no alternative explanation for the recent warming other than an enhanced greenhouse effect due to human activities.
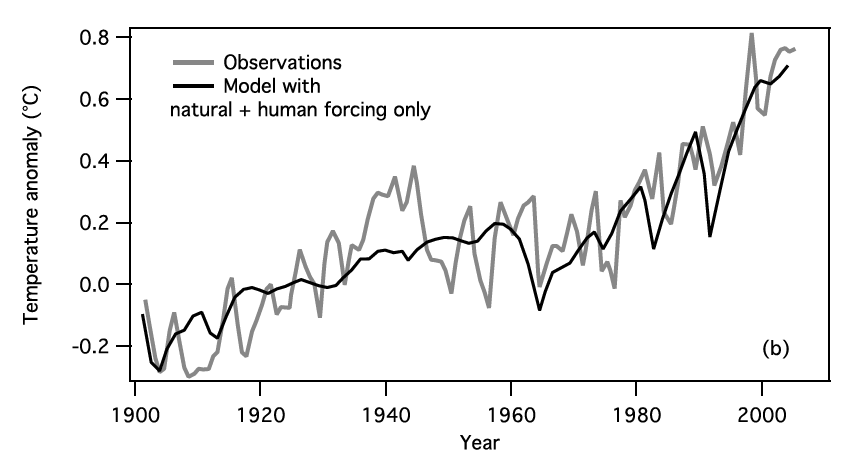
Fig. 3. Global mean surface temperature anomalies from the surface thermometer record (gray line), compared with a coupled ocean- atmosphere climate model (black line). The model includes natural forcing and human greenhouse - gas emissions, aerosols, and ozone depletion. Anomalies are measured relative to the 1901 - 1950 mean. Source: Fig. 3.12 of Dessler and Parson [2010], which was an adaptation of Fig. TS.23, Solomon et al.[2007]
These points fit into a more general context about how science works. Making successful predictions is the gold standard of science. If a theory successfully predicts phenomena that are later observed, one can be confident that the theory captures something essential about the real world system. The standard model has done that. For example, climate scientists predicted in 1967 that the stratosphere would cool while the troposphere warmed as a result of increasing greenhouse gases. This was observed 20 years later. Climate models predicted in the 1970s that the Arctic would warm faster the Antarctic. This has also been subsequently confirmed
22. Some of these examples are taken from the 2012 AGU Tyndall Lecture by R. Pierrehumbert, http://fallmeeting.agu.org/2012/events/tyndall-lecture-gc43i-successful-predictions-video-on-demand/
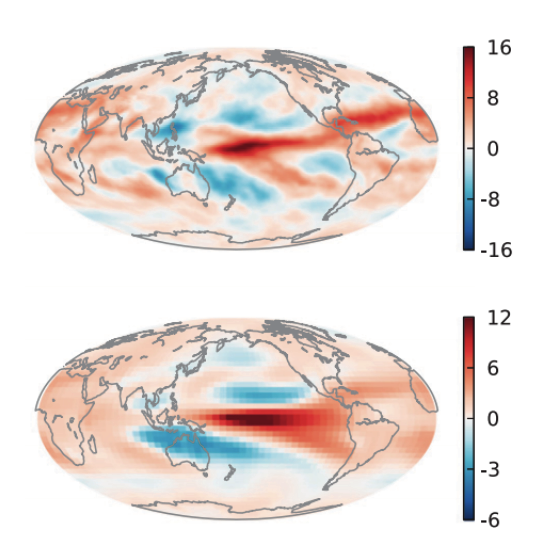
Figure 4. The spatial distribution of the water vapor feedback (W/m2/K) in (top) observations between 2000 and 2010 and (bottom) control runs of CMIP3 models. Adapted from Fig. 2 of Dessler [2013].
Figure 4 shows the spatial distribution of the water vapor fee dback in observations and in climate models.The model calculations are fundamentally a prediction because they were done before the observations were available. The agreement is excellent, and I take from this high confidence in the ability of the models to simulate this feedback. And given the importance of this process in driving climate change, I take this as a strong validation of the standard model generally.
And this is just the tip of the melting iceberg of successful predictions that the climate science community has made using the standard model. Other successful predictions include an increase in energy stored in the ocean, amplification of heating over land during transient warming, etc. The list goes on and on — far too many to catalog here
The standard model also explains the paleoclimate record. In the 1980s, my colleague Prof. Jerry North was trying to use energy balance models to simulate the ice ages and he just couldn't get the model to simulate those cold periods. Then, in the 1990s, ice core data showed that carbon dioxide was much lower during ice ages. When Prof. North included that reduction of carbon dioxide into the model, voila! —he could suddenly simulate the cold temperatures necessary to account for the ice ages.
In addition, there are many occasions where the observations and the standard model disagreed, and it turned out that the observations were wrong. For example, in the 1980s, paleoclimate reconstructions suggested that the Tropics did not cool much during the last Ice Age, while the standard model found that to be inconsistent with the land-based data. More recent syntheses, however, have shown that the Tropics actually cooled more than previously thought—in good agreement with the standard model.
Another example is the cooling observed in the MSU satellite temperature record in the 1990s. The standard model told us that cooling of the troposphere is inconsistent with surface temperature increases. But after corrections to the satellite data processing were made, they now both show warming. Disagreements between this data set and climate models still exist, but ongoing studies of the satellite record are uncovering more issues in it [e.g., Po-Chedley and Fu, 2012]. I suspect future revisions will bring it into ever-closer agreement with the models.
Thus, we have a standard model of climate science that is capable of explaining just about everything. Naturally, there are some things that aren’t necessarily explained by the model, just as there're a few heavy smokers who don't get lung cancer. But none of these are fundamental challenges to the standard model.
An excellent example of a challenge to the standard model is the so-called “hiatus”[Trenberth and Fasullo, 2013]: a lack of warming in the surface temperature record over the last decade or so. This is frequently presented as an existential threat to the standard model, but as I describe below that greatly exaggerates its importance.
To begin, the lack of a decadal trend in surface temperatures does not mean that warming has stopped. Figure 2 shows the continued accumulation of heat in the bulk of the ocean, which is a clear marker of continued warming. And because heat can be stored in places other than at the surface, a lack of surface warming for a decade tells you almost nothing about the underlying long-term warming trends.
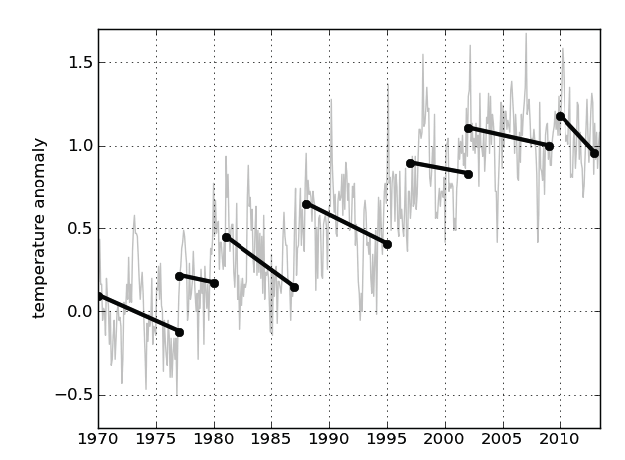
More quantitatively, Figure 5 shows surface temperature anomalies between 1970 and 2013. Over this period, the planet warmed rapidly, at a rate of 3°F/century. Also plotted on this figure are short-term trends based on endpoints that were selected to demonstrate short-term cooling trends. As you can see, it’s possible to generate a nearly continuous set of short-term cooling trends, even as the climate is experiencing a long-term warming. This would allow someone to claim that global warming had stopped or even that the Earth had entered a cooling period —even though the climate is rapidly warming!
As Fig. 5 shows, the problem in very short temperature trends (like a decade) is that climate variability such as El Niño cycles completely confounds ones ability to see the underlying trend. However, this short-term variability can be removed, and, if one does that, then the hiatus essentially disappears [Foster and Rahmstorf, 2011; Kosaka and Xie, 2013]. Because of this, I judge that there is virtually no merit to suggestions that the “hiatus” poses a serious challenge to the standard model.
Fig. 5. A plot of monthly and global average surface temperature anomalies (°F)from the GISS Surface Temperature Analysis (gray line) along with selected negative short-term trend lines (black lines). This figure is inspired by Skeptical Science’s escalator plot (http://www.skepticalscience.com/graphics.php?g=47)
Nevertheless, it would be wrong for me to claim that the standard model includes a robust understanding of the interaction of ocean circulation, short-term climate variability, and long-term global warming. Viewed that way, the “hiatus” is an opportunity to refine and improve our understanding of these facets of the standard model. Papers are already coming out on this subject [e.g., Kaufmann et al., 2011; Kosaka and Xie, 2013; Solomon et al., 2010]and I suspect that, in a few years, our understanding of this phenomenon will be greatly improved.
What about alternative theories? Any theory that wants to compete with the standard model has to explain all of the observations that the standard model can. Is there any model that can even come close to doing that?
No. And making successful predictions would help convince scientists that the alternative theory should be taken seriously. How many successful predictions have alternative theories made?
Zero. Based on everything I discussed above, and more, the Working Group I report recently released by the IPCC concludes that humans are extremely likely to be the cause of most of the warming over the last few decades. Note that this does not claim that humans are the ONLY cause, nor does it claim that we are 100% certain. But given the amount of work that’s gone into studying this and the amount of evidence in support of it that has emerged, my view is that this statement is, if anything, conservative.
3. Future warming could be large As a consequence of our understanding of the climate system, unchecked greenhouse-gas emissions would lead to warming over the 21st century of 4.7-8.6°F
3 (for the global average). Regionally, on land and in the Arctic, the warming is apt to be larger.
3. Based on an ensemble of RCP8.5 runs. These warmings may not sound like much until you realize that the warming since the last ice age —a warming that completely reconfigured the planet—was 9°F-14°F (5-8°C). The upper limits of projected warming over the 21
st century would therefore herald a literal remaking of the Earth’s environment and our place within it.
4. The impacts of this are profound. Before I begin talking about impacts, it is worth discussing the value of talking about what we know rather than what we don't know. Focusing on what is unknown can lead to an incorrect perception of uncertainty. For example, we don't know the exact mechanism by which smoking cigarettes causes cancer. Nor do we know how many cigarettes you have to smoke to get cancer. Nor can we explain why some heavy smokers don't get cancer, while some non-smokers do. Based on this, you might conclude that we don't know much about the health impacts of smoking. But that's wrong. Despite these unknowns, it is certain that smoking increases your risk of health problems.
In the climate debate, we can argue about what we know or what we don’t know. Arguing about what we don’t know can give the impression that we don’t know much, even though some impacts are virtually certain.
The virtually certain impacts include:
•increasing temperatures
•more frequent extreme heat events
•changes in the distribution of rainfall
•rising seas
•the oceans becoming more acidic
In my judgment, those impacts and their magnitude are, by themselves, sufficient to compel us to act now to reduce emissions.
And there are a number of impacts that may occur, but are not certain. We may see changes in drought intensity and distribution, and increases in flood frequency. And we have an expectation that hurricanes will get stronger, although their numbers might decrease. And there’s always the risk of a surprise, like the Antarctic ozone hole, where some high consequence impact that we never anticipated suddenly arises.
We can argue about these less certain impacts, and scientific research in these areas is very active, but they should not distract us from those that are virtually certain.
In conclusion, things are beginning to change rapidly. More and more frequently it seems we pass another climate milestone —hottest year of the modern temperature record, highest CO2in perhaps a million years, etc. Because of inertia in the climate system, every year we don’t take action commits us to about 2% more eventual warming [Allen and Stocker, 2014]. In other words, if we start taking appropriate action today, we can limit global warming to 2°C. But, if we wait 10 years to begin to reduce emissions, then the same level of effort will lead to warming of 2.4°C. Time is not our friend in this problem. By the time everyone agrees we have a problem, it is too late to do much about it.
The scientific community has been working on understanding the climate system for nearly 200 years. In that time, a robust understanding of it has emerged. We know the climate is warming. We know that humans are now in the driver’s seat of the climate system. We know that, over the next century, if nothing is done to rein in emissions, temperatures will likely increase enough to profoundly change the planet. I wish this weren’t true, but it is what the science tells us.
ReferencesAllen, M. R., and T. F. Stocker (2014), Impact of delay in reducing carbon dioxide emissions, Nature Clim. Change, 4, 23-26, 10.1038/nclimate2077.
Balmaseda, M. A., K. E. Trenberth, and E. Kaellen (2013), Distinctive climate signals in reanalysis of global ocean heat content, Geophys. Res. Lett., 40, 1754-1759, 10.1002/grl.50382.
Dessler, A. E. (2013), Observations of climate feedbacks over 2000-10 and comparisons to climate models, J. Climate, 26, 333-342, 10.1175/jcli-d-11-00640.1.
Dessler, A. E., and E. A. Parson (2010), The science and politics of climate change: A guide to the debate, Cambridge Univ. Press.
Foster, G., and S. Rahmstorf (2011), Global temperature evolution 1979-2010, Environmental Research Letters, 6, 10.1088/1748-9326/6/4/044022.
Hansen, J., R. Ruedy, M. Sato, and K. Lo (2010), Global surface temperature change, Rev. Geophys., 48, Rg4004, 10.1029/2010rg000345.
Kaufmann, R. K., H. Kauppi, M. L. Mann, and J. H. Stock (2011), Reconciling anthropogenic climate change with observed temperature 1998–2008, Proc. Natl. Acad. Sci., 108, 11790-11793, 10.1073/pnas.1102467108.
Kosaka, Y., and S.-P. Xie (2013), Recent global-warming hiatus tied to equatorial Pacific surface cooling, Nature, advance online publication, 10.1038/nature12534.
Po-Chedley, S., and Q. Fu (2012), A Bias in the Mid-tropospheric Channel Warm Target Factor on the NOAA-9 Microwave Sounding Unit, Journal of Atmospheric and Oceanic Technology, 29, 646-652, 10.1175/jtech-d-11-00147.1.
Solomon, S., K. H. Rosenlof, R. W. Portmann, J. S. Daniel, S. M. Davis, T. J. Sanford, and G. K. Plattner (2010), Contributions of stratospheric water vapor to decadal changes in the rate of global warming, Science, 327, 1219-1223, 10.1126/science.1182488.
Solomon, S., D. Qin, M. Manning, R.B. Alley, T. Berntsen, N.L. Bindoff, Z. Chen, A. Chidthaisong, J.M. Gregory, G.C. Hegerl,M. Heimann, B. Hewitson, B.J. Hoskins, F. Joos, J. Jouzel, V. Kattsov, U. Lohmann, T. Matsuno, M. Molina, N. Nicholls, J.Overpeck, G. Raga, V. Ramaswamy, J. Ren, M. Rusticucci, R. Somerville, T.F. Stocker, P. Whetton, R.A. Wood and D. Wratt (2007),Technical Summary. In: Climate Change 2007: The Physical Science Basis. Contribution of Working Group I to the FourthAssessment Report of the Intergovernmental Panel on Climate Change [Solomon, S., D. Qin, M. Manning, Z. Chen, M. Marquis,K.B. Averyt, M. Tignor and H.L. Miller (eds.)]. Cambridge University Press, Cambridge, United Kingdom and New York, NY,USA.
Trenberth, K. E., and J. T. Fasullo (2013), An apparent hiatus in global warming?, Earth's Future, 10.1002/2013EF000165


