Wednesday, April 14, 2010

Denialists denied again

The Independent Inquiry headed by Lord Oxborough on the Climate Research Unit has reported. The wild charges (hi there Steve:) against the CRU were emphatically rejected by the Inquiry. To the right, Nelson well expresses our views on this failed denialist jihad. Like Tamino, Eli fears he will age waiting for apologies.

UPDATE: Eli will put up a separate post on this later but Rabett Run has many visitors at the moment. Besides the sporting aspect there is a great reason to shove these reports virgorously down the throats of some who will not be mentioned. Besides their uncalled for denigration of honorable scientists and excellent science, the alphabet soup of denialist think tanks has based their petition the US EPA for reconsideration of the CO2 Endangerment Finding on the CRU Emails. The various official inquiries reporting back on how vicious and vacuous the jihad has been strip the petitions and petitioners of standing. The more HaHa we generate leaves them standing naked in the public square. Believe Eli, an unclothed Tony Watts, is an ugly thing. (not that yrs truly is svelte, mind you, but he is cute, ask Ms. Rabett)

The charge of the Committee was

The Panel was set up by the University in consultation with the Royal Society to assess the integrity of the research published by the Climatic Research Unit in the light of various external assertions. The Unit is a very small academic entity within the School of Environmental Sciences. It has three full time and one part time academic staff members and about a dozen research associates, PhD students and support staff. The essence of the criticism that the Panel was asked to address was that climatic data had been dishonestly selected, manipulated and/or presented to arrive at pre-determined conclusions that were not compatible with a fair interpretation of the original data.
Keith Briffa (dendochronology), Phil Jones (surface temperature reconstructions) and their colleagues had been accused of data murder and rape by the usual suspects. The Inquiry finds these accusations to be infamous lies.

The Inquiry first recognizes something important about tree rings
Chronologies (transposed composites of raw tree data) are always work in progress. They are subject to change when additional trees are added; new ways of data cleaning may arise (e.g. homogeneity adjustments), new measurement methods are used (e.g. of measuring ring density), new statistical methods for treating the data may be developed (e.g. new ways of allowing for biological growth trends).
Much of the criticism came from the fly-in-amber school of science, where nothing ever changes, where initial publications must be perfect. The Inquiry report remarks that the nature of the dendro beast (and indeed, most other science) implies choices in data selection guided by experience, expertise and statistics. They ding the CRU for not having sufficient statistical expertise, but conclude
8. After reading publications and interviewing the senior staff of CRU in depth, we are satisfied that the CRU tree-ring work has been carried out with integrity, and that allegations of deliberate misrepresentation and unjustified selection of data are not valid. In the event CRU scientists were able to give convincing answers to our detailed questions about data choice, data handling and statistical methodology. The Unit freely admits that many data analyses they made in the past are superseded and they would not do things that way today.
The Inquiry demurs,
9. We have not exhaustively reviewed the external criticism of the dendroclimatological work,
Wise folk, wading into the Climate Audit swamp requires at least six months of cleaning under the nails afterwards, and they continue with extreme British understatement
but it seems that some of these criticisms show a rather selective and uncharitable approach to information made available by CRU. They seem also to reflect a lack of awareness of the ongoing and dynamic nature of chronologies, and of the difficult circumstances under which university research is sometimes conducted. Funding and labour pressures and the need to publish have meant that pressing ahead with new work has been at the expense of what was regarded as non-essential record keeping. From our perspective it seems that the CRU sins were of omission rather than commission.
The last bit is the one you are going to see at Climate Audit
Although we deplore the tone of much of the criticism that has been directed at CRU, we believe that this questioning of the methods and data used in dendroclimatology will ultimately have a beneficial effect and improve working practices
without the first line which will be left in the quote mine.

On to Phil Jones and the CRUTEMP surface temperature reconstructions.
4. Like the work on tree rings this work is strongly dependent on statistical analysis and our comments are essentially the same. Although there are certainly different ways of handling the data, some of which might be superior, as far as we can judge the methods which CRU has employed are fair and satisfactory. . . .

All of the published work was accompanied by detailed descriptions of uncertainties and accompanied by appropriate caveats. The same was true in face to face discussions.
5. We believe that CRU did a public service of great value by carrying out much time-consuming meticulous work on temperature records at a time when it was unfashionable and attracted the interest of a rather small section of the scientific community.
Reaching an overall conclusion about the CRU's work
1. We saw no evidence of any deliberate scientific malpractice in any of the work of the Climatic Research Unit and had it been there we believe that it is likely that we would have detected it. Rather we found a small group of dedicated, if slightly disorganised, researchers who were ill-prepared for being the focus of public attention. As with many small research groups their internal procedures were rather informal.
The Inquiry picks up on James Annan's point that governments are insisting on charging for data they create while demanding that it be free to all. And, horrors, they come pretty close to recommending that FOI laws be modified to prevent their vexious use
4. A host of important unresolved questions also arises from the application of Freedom of Information legislation in an academic context. We agree with the CRU view that the authority for releasing unpublished raw data to third parties should stay with those who collected it.
George Monbiot will call it white wash

Eli thanks Tracy and http://nelsonhaha.com for the appropriate comment

Tuesday, April 13, 2010

A Puzzler, where did Loehle go too far?


what's too far said he

where you are said she - ee cummings
The bunnies have been asking what's wrong with the rather strange roughly cylindrical brown object that Craig Loehle left lying on the sidewalk at Atmospheric Environment. The constant nattering has woken Eli from his retirement nap so he might as well have a go.

This is a case, where when you see the trick you want to go punch the referees, decapitate the editor and shoot the author into space with a one way ticket. It starts with a paper by Hofmann, Butler and Tans in the same journal which looked at how fast the CO2 mixing ratio has been growing since ~1800. They find a close correlation between population growth and the mixing ratio, indeed, in 1987 (note added in proof) Newell and Marcus had suggested that monitoring CO2 mixing ratio growth was a reasonable way of monitoring global population.

HBT show that the CO2 mixing ratio has been growing very close to exponentially since ~ 1960 when monitoring at Mauna Loa started, although going back further than that on the basis of ice cores shows slower growth in earlier times. They then try to tie everything together to suggest
Besides showing the insight gained by removing pre-industrial CO2 in explaining the curvature in the Mauna Loa CO2 record, and organizing the confusion on growth rates, does this new analysis of the CO2 record have any further use for the future? One possibility is to use it to watch for the expected and necessary break of the exponential nature of CO2 and its growth rate. Fig. 4 shows an exponential fit to the past 14 years of Mauna Loa anthropogenic CO2 data and the residual between the data and the exponential function. The residual has varied from zero less than 1% over this time period. A sustained downward trend of the residual by more than 1% (in the absence of any known major volcanic event) would be a clear sign of a change in the nature of anthropogenic atmospheric carbon dioxide, and a possible gauge of progress in the inevitable need to limit atmospheric CO2. Similarly, a break in the close relation between anthropogenic CO2 and population would signal that a change in ‘‘business as usual’’ had occurred.
For anyone who needs a shorter HBT, they said watch for deviations from exponential growth on short to medium term intervals to spot changes in emissions. They did not predict future emissions but they did discuss the entire record. Let Eli see what Loehle did according to Loehle
A paper by Hofmann et al. (2009, this journal) is critiqued. It is shown that their exponential model for characterizing CO2 trajectories for historical data is not estimated properly. An exponential model is properly estimated and is shown to fit over the entire 51 year period of available data. Further, the entire problem of estimating models for the CO2 historical data is shown to be ill-posed because alternate model forms fit the data equally well. To illustrate this point the past 51 years of CO2 data were analyzed using three different time-dependent models that capture the historical pattern of CO2 increase. All three fit with R2 > 0.98, are visually indistinguishable when overlaid, and match each other during the calibration period with R2 > 0.999. Projecting the models forward to 2100, the exponential model comes quite close to the Intergovernmental Panel on Climate Change (IPCC) best estimate of 836 ppmv. The other two models project values far below the IPCC low estimates. The problem of characterizing historical CO2 levels is thus indeterminate, because multiple models fit the data equally well but forecast
very different future trajectories.
Watch the pea. The IPCC estimate is for A PARTICULAR EMISSION SECENARIO, it is not a projection of the last fifty years of measuring CO2 mixing ratios, nor is it the only emission scenario. Fast work there folks. Still, Eli is a trusting bunny so let us go on. The three fitting forms and Loehle's values for the parameters are
  • the exponential, a + b exp(ct),
    a=259.4, b=2.978 x 10⁻¹³, and c= 0.01677

  • the quadratic, a + bt + ct2
    a= 45 318.5, b= -46.7684, and c = 0.0121
    (Gives a really bad fit. a is adjusted to 45504 for a decent fit)

  • and the saturated, c + a(1-exp[b(t-d)])2
    a= 616.694, b= -0.0067, c= 311, and d= 1945.7
and this is what Craig shows,
but Eli made a somewhat fuller picture, using the Loehle's values (click on the graphs for better views)

The exponential model, although not perfect, does match the CO2 mixing ratio much better at earlier times than 1959, so, contrary to Loehle, the three models are not equally plausible. But there's more. Eli also did his own fit.

The saturating curve here is much closer to the data and the exponential curve. Still, young bunnies, there is still something like junior high school wrong with what Craigie poo did. Flip to the continuation for the answer


------------------------------------------------


Loehle extrapolated all of his fits from the year dot. Little ones can spot this in his value for b in the exponential fit and for a in the quadratic and d in the saturated one. If the time is replaced the three fitting forms by [t-1985] you get much much improved saturated fits. The quadratic fit still sucks at early times (and late ones) but even it comes closer to the other two..

The extrapolations are shown below.


Model

Year 0 Loehle

Year 0 Eli

Year 1985 Eli

2000

Exp

370

369

369


Quad

367

367

370


Saturated

368

370

370

2050

Exp

513

513

510


Quad

479

479

490


Saturated

467

500

512

2100

Exp

846

846

819


Quad

651

651

668


Saturated

567

729

834


The referees and the editor missed the slight of hand, they also did not read Hoffman, et al. The graphs demonstrate that quadratic fits are not industrial grade for this problem, and the table and graphs show that Loehle's fits are fishy. Doesn't anyone check the programming? Where are the auditors when you need them.

Eli has placed an Excel spreadsheet at the memory hole for those who want to play around with the numbers.

Monday, April 12, 2010

Eli can retire Part VIII - The EPA reads Rabett Run

Well, well, well, Eli discovers that the EPA reads everything, including Rabett Run. We are honored. From the US EPA responses to challenges to its Endangerment Finding for increasing CO2 concentrations

Comment (3-45):
A number of commenters believe that anthropogenic global warming is impossible, many citing arguments made by Gerlich and Tscheuschner (2009). Several commenters (e.g., 0430) note that the greenhouse effect is not like a real greenhouse. Several claim that it is thermodynamically impossible because heat cannot be transferred from a cool substance to a warmer substance (0430, 2210.5): for example, blankets cannot make you warmer than body temperature (1707, 0183.1,). Another thermodynamic argument for the impossibility of the greenhouse effect was proposed by two commenters (2210.3, 4509) citing Gerlich and Tscheuschner (2009) who states that the greenhouse effect as commonly formulated violates the Second Law of Thermodynamics. Another commenter (0711.1) requests evidence of any peer reviewed climate change paper that does not rely on computer simulation. Another theory (2887.1) holds that long-wave radiation will cause increased evaporation of the surface ocean, negating any heat increase. One commenter (0535) submitted a non-peer reviewed paper providing a different explanation for the net energy budget of the Earth, with no role for warming by CO2.

Response (3-45):

The evidence for the atmospheric greenhouse effect is well supported by the scientific literature.

The objections raised by a number of commenters to the basic thermodynamics are without grounds. We are well aware that the greenhouse effect is not at all like a real greenhouse. However, the analogy of a blanket is a little bit better: and indeed, sufficiently insulating blankets can cause overheating. GHGs (blankets) will, by reducing the rate of heat loss, raise the surface temperature of the Earth (body) until a new thermodynamic balance is achieved between incoming solar radiation (internal body heating) and outgoing thermal radiation (in the case of a blanket, including convection and non-radiative processes). This process works regardless of whether the atmosphere (blanket) is cooler than the surface (body). We are aware of the paper by Gerlich and Tscheuschner, and we have determined that the conclusions of the paper are inconsistent with the well-supported literature regarding the mechanism of the greenhouse effect. For example, as a disproof of the greenhouse effect, the paper by Gerlich and Tscheuschner presents the example of a pot of water, noting that the bottom of the pot will be cooler if it is filled with water than if it is empty. Contrary to the assertion in the paper, the primary thermal effect of adding water to the pot is not a reduction in heat transfer, but rather an increase of thermal mass. We assert that a more appropriate example for the paper to have examined would have been the addition of a lid to a pot of water, which reduces the rate of heat loss, and leads to an increase of heating of the water compared to a case with no lid. The paper by Gerlich and Tscheuschner is also inconsistent with the scientific literature with regards to the interpretation of radiative balance diagrams and the assertion that there is no “mean temperature” of the Earth, in contrast to the hundreds of peer-reviewed publications and many assessment reports which use both concepts.
You read it first at Rabett Run
This, of course, neglects the latent heat carried away from the pot and thus the heating element by evaporation of the water in the pot. Since it is well known that people who are physics obsessed are often forgetful, we postulate that the housewife forgets that she has put the pot on the range, and all the water boils away. At that point, when all the water has evaporated, measurements show that the heating element rises to a higher temperature than it was before the tea pot was placed on it.
and, of course, there are the famous Rabett blanket posts

EPA Rocks!!

Sunday, April 11, 2010

Monckton jumps the land shark. Gets eaten


UPDATE: John Nielsen-Gammon drops by to say that he found the same errors in May 2009 and received roughly the same pretentious short shrift from Chris Monckton. Eli rather suspects that you can tell Chris he is wrong, show him in detail, prove it in spades, and what ya wanna bet, Monckton will keep repeating the nonsense ad infinitum till you bite em.
------------------------------------
In this case, the land shark has pretty teeth too, and his name is Barry Bickmore, a professor of geology at Brigham Young University. Utah is a REAL Republican state, and the BYU is an institution of the Church of Latter Day Saints (Mormons). Bickmore is a devout Mormon. As an important sign of the worm turning, the tale first appears under the byline of Judy Fahys, at the Salt Lake City Tribune, a majorUtah newspaper. Bickmore and is soon to appear at Real Climate

"The moral of the story is not that amateurs should stay out of the debate about climate change," writes Bickmore, who noted that he is a geologist rather than a climate scientist.

"Rather, the moral is that when you see a complete amateur raising objections about a highly technical subject, claiming that he or she has blown the lid off several decades of research in the discipline, you should be highly suspicious."

Bickmore has solved two mysteries. The first is where Monckton's claimed IPCC CO2 mixing ratio projections came from. What the IPCC did was feed the A2 emission scenario into a bunch of models and see what they predicted for CO2 mixing ratios. Since this was an emission scenario, and there were a bunch of scenarios of which A2 was among the most extreme, the range of predictions is mostly lower, however, we do appear to be following A2 fairly closely. Monckton also messed up the results of the modeling exercise because he does not understand the difference and relationship between an emissions scenario and a resutling model prediction of mixing ratios. Eli will let Prof. Brickmore explain honor among bloggers and all that.

Even better, as the Salt Lake Tribune explains, Monckton and Bob Ferguson, president of Moncktons fiction publisher, tried to threaten Brickmore.

Monckton did not respond to requests for comment. Nor did Bob Ferguson, president of the Science and Public Policy Institute, which sponsored Monckton's recent appearance at Utah Valley University.

But, in their emails to Bickmore over the past few weeks, Monckton and Ferguson accuse the scientist at LDS Church-owned BYU of personal attacks, and both threaten him.

Ferguson ends a Thursday e-mail by hinting there might be repercussions through their shared faith.

"I trust you are gentleman and Christian enough to not bear such false witness," Ferguson concludes. "If not, I will seek both professional and ecclesiastical redress for 'conduct unbecoming'."

In an exchange a week earlier, Monckton said that Bickmore's "unjustifiable and gratuitous remarks about my habitual mendacity are to be drawn to the attention of the President of the University... to be investigated as a disciplinary matter." Monckton also said he had spoken with "some of the University's leading supporters" about Bickmore's role in the university's decision not to host Monckton's climate-change speech.

"This, too, I understand, is to be referred to the University as a disciplinary matter, since the University prides itself on allowing academic freedom," Monckton wrote.

Bickmore said Friday he is not aware of any investigation or disciplinary action. And university spokesman Michael Smart said none was in the works.

"Barry Bickmore is not and has not been under academic investigation," Smart said. "There is no basis for any accusation that he is."

Emails, Barry got Emails, and Bickmore [corrected] bit back by writing the House of Lords to ask if Monckton was a member and got a succinct reply
"Christopher Monckton is not and has never been a Member of the House of Lords. There is no such thing as a 'non-voting' or 'honorary' member."
As Bickmore told the Salt Lake Tribune
The false claims undermine Monckton's credibility in a way that is easy for anyone to understand, said Bickmore. They open a window onto the skeptic's scientific claims, like his assertion that the Intergovernmental Panel on Climate Change is wrong about global warming.
Eli awaits details appearing at Real Climate, but the first bite was scrumptious

Saturday, April 10, 2010

Eli can retire Part VII - The EPA plays so's your old man

Well, well, well, Eil discovers that the EPA reads everything, and laughs at some of them. From the US EPA responses to challenges to its Endangerment Finding for increasing CO2 concentrations

Comment (1-12):
Several commenters (1924, 2898.1, 3214.1, 3330.1, 3389, 3446.2, 3560.1, 3679.1, 3748.1, 3969.1, and 4172) argue that EPA should base its endangerment finding on the recent Nongovernmental International Panel on Climate Change (NIPCC) report entitled Climate Change Reconsidered, instead of IPCC and CCSP reports.

Response (1-12):
EPA has reviewed and considered the NIPCC report and found that it lacks the rigorous procedures and transparency required to serve as a foundation for the endangerment analysis. A review of the NIPCC Web site indicates that the NIPCC report was developed by “two co-authors” and “35 contributors and reviewers” from “14 countries (http://www.nipccreport.org/index.html). The organization does not appear to have established any procedures for author selection and provides no evidence that a transparent and open public or expert review was conducted. Thus, the NIPCC’s approach stands in sharp contrast to the clear, transparent, and open procedures of the IPCC, CCSP, USGCRP, and NRC. Relying on the work of the major assessment reports is a sound and reasonable approach. See Section III.A. of the Findings, “The Science on Which the Decisions Are Based,” for our response to comments on the use of the assessment literature and previous responses in this section regarding our treatment of new and additional scientific literature provided through the public comment process.

Although EPA sees no reason to base the endangerment analysis on the NIPCC, we did thoroughly review the report and the associated references. For EPA’s responses to comments and literature provided on specific climate science issues in the TSD, including the work of the NIPCC, please refer to the appropriate Response to Comment volumes.
Don't wanna mess with those guys

Friday, April 09, 2010

The sadists, the masochists and the scientists

Andy Revkin moves to the opinion side of the house, George Monbiot tries to pull out of the CRU hole, Stoat foams at the mouth about the whole thing

And (rather small beer by comparison) Monbiot thinks that cliamte scientists are like paedophiles (I exaggerate just a little for effect, you understand). But its still hopeless stuff, even if mt likes it. The best defence of Monbiot I can think of is that he is just using this incident to push his pet point of view with no great interest in reality, which is sad.
and, predictably CP Snow's two cultures business comes up again, even after Eli dipped into that one
So, what's going on Eli asks?

Well, IEHO, there is a disjunction, but it's a strange one. Scientists can't figure out why reporters keep giving space to denialists who keep on burning them and, of course, the denialists keep on burning them and the reporters keep on taking it.
Eli is pleased to note that Monbiot, provided an important clue to what's happening. The reporters are the masochists, the denialists, the sadists, and the scientists? We just want to be left alone to indulge in some interesting straight sex.

What's your pleasure?

Thursday, April 08, 2010

Eli can retire Part VI - Going where the sun don't shine

Ms. Rabett told Eli to get off his tired old well the bunnies know what, and go where the sun don't shine. So the Rabett dialed up the US EPA responses to challenges to its Endangerment Finding for increasing CO2 concentrations and considered the matter of solar influences

Comment (3-35):
A number of commenters (e.g., 0670) argue that the sun is the primary driver of global temperature changes. Several commenters (3323.1, 4003, 4041.1, 4932.1, and 5158) referred to a new 2009 paper by Scafetta and Willson suggesting that the IPCC used faulty solar data in dismissing the direct effect of solar variability on global temperatures. Commenters also cite other research by Scafetta and others that suggests that solar variability could account for up to 68% of the increase in Earth’s global temperatures. One commenter (1616.1) attributes 0.14°C of the warming since 1950 to increased solar irradiance, and another 25% of warming since 1979, as in Scafetta and West (2006) (3596.1). Another commenter (7031) states that the correlation between solar variations such as sunspots and global climate has been pointed out by several scientists, such as Scafetta and West (2008). A number of specific climate-related regional phenomena have been related by commenters (e.g., 3596.1) to solar variability, such as sea surface temperature, floods, droughts, monsoons, and North Atlantic drift ice.

Response (3-35):
We have reviewed the comments and the literature submitted and have determined that changes in solar irradiance are not a sufficient explanation for recent climate change. The contention that direct solar variability can explain recent warming is not supported by the bulk of the scientific literature. As the TSD notes, the IPCC Fourth Assessment Report estimates that changes in solar irradiance since 1750 are estimated to cause a radiative forcing of +0.12 (+0.06 to +0.30) W/m2, or approximately 5% of the combined radiative forcing due to the cumulative (1750–2005) increase in atmospheric concentrations of CO2, CH4, and N2O (2.30 W/m2 with an uncertainty range of +2.07 to +2.53 W/m2). The natural 11-year cycle of solar irradiance has a magnitude of less than 2 W/m2 at the distance of the Earth—which, once corrected for albedo and distribution over the surface area of the planet, is a magnitude of less than 0.35 W/m2.

In addition, Karl et al. (2009) state that “if most of the observed temperature change had been due to an increase in solar output rather than an increase in GHGs, Earth’s atmosphere would have warmed throughout its full vertical extent, including the stratosphere. The observed pattern of atmospheric temperature changes, with its pronounced cooling in the stratosphere, is therefore inconsistent with the hypothesis that changes in the Sun can explain the warming of recent decades. Moreover, direct satellite measurements of solar output show slight decreases during the recent period of warming.” A number of other recent studies also show results that contrast with the interpretation that solar variability is driving recent warming. Both Lockwood and Fröhlich (2008) and Lean and Rind (2009) show that the solar contribution to warming in recent decades has been small or negative, consistent with the IPCC attribution of most of the warming in recent decades to anthropogenic GHGs.

The attribution of components historical climate change to solar activity involves a number of issues. The first is the actual reconstruction of historical solar activity: even for the last three decades there is some controversy, as is evident in the differences between Scafetta and Willson (2009), which uses a total solar irradiance composite from the Active Cavity Radiometer Irradiance Monitor (ACRIM) analysis of satellite data, and Lockwood and Fröhlich (2008), which uses a composite based on the Physikalisch- Meteorologisches Observatorium Davos (PMOD) analysis of satellite data. These two composites don’t even agree on the sign of the solar irradiance trend over this time period.

Lockwood and Frolich analyze both datasets and find that the ACRIM dataset is inconsistent with methods of historical reconstructions that have shown correlations between historical solar activity and climate. Krivova, Solanki, and Wenzler (2009) also find no evidence of an increase in total solar irradiance (TSI) from 1986 and 1996 using an analysis based on magnetograms. Scafetta and Willson, on the other hand, claim that the PMOD approach requires a correction of the data from the earth radiation budget (ERB) system on the NIMBUS7 satellite, and this correction has been rejected by one of the scientists on the NIMBUS team (D.V. Hoyt, personal communication to Scafetta, 2008). Neither dataset shows an increase of solar irradiance between the minima of 1986 and 2008, which would be required in order to explain warming over that period.

Therefore, reconstructions of recent solar variability do not agree, but in one case show no trend, and in the case of the Lockwood and Fröhlich reconstruction the solar contribution during this period would have been a cooling, not warming, influence.

The second issue is that in order for solar irradiance to be a major driver of recent warming, there must be an amplification effect that is active for solar irradiance that is not active for forcing due to GHGs. Studies such as Scafetta (2009) often rely on a significantly different factor for solar irradiance than is used for GHG climate sensitivity. Additionally, the Scafetta study relies on a “slow lag” solar response and the timescale chosen has itself been the subject of dispute. The climate sensitivity for this slow lag response used by Scafetta is 0.46° K/Wm-2. Note that this is compared to the total solar irradiance: therefore, the effective sensitivity to the average solar irradiance according to Scafetta would be (4*0.46)/0.7 = 2.6° K/Wm-2. This can be compared to a climate sensitivity range of 2 to 4.5, or about 0.5° K/Wm-2 to 1.2° K/Wm-2. Additionally, Scafetta claims that solar variability accounts for most of the recent warming and that GHG sensitivity is on the low end of the range: this means that Scafetta is effectively claiming that sensitivity to solar variability is on the order of five times the sensitivity to forcing by GHGs, without a good mechanism to explain this extreme difference. Although it is not impossible that there are differences between solar and GHG induced changes, the evidence for an amplification of the magnitude needed to explain recent warming is weak. For example, while Meehl et al. (2009) find an amplification of the solar cycle variability is needed to explain certain patterns of tropical Pacific climate response, the authors note: “This response also cannot be used to explain recent global warming because the 11-year solar cycle has not shown a measurable trend over the past 30 years.”

Moreover, the sensitivity needed is nowhere near as large as the Scafetta sensitivity, and the behavior explained is geographically localized, which is different from a global increase in sensitivity. Therefore, the evidence for an amplification of the magnitude needed to explain recent warming is weak.

Some other authors also show some correlations between solar variability and regional trends. Eichler et al. (2009) find a strong correlation between solar activity (as reconstructed by carbon-14 and beryllium-10 proxies) and temperatures in the Siberian Altai region. However, the authors note that “underlying physical processes are still not yet understood” in terms of amplifying a weak solar signal (in terms of radiative forcing) in order to see larger effects, and also that “[i]n large spatial scale hemispheric or global reconstructions the solar signal may therefore even vanish” because the “main effect of solar forcing is presumably on location, routes, and stability of atmospheric pressure systems, which all act on regional scales.” The conclusion of the Eichler work is that while solar activity was a main driver for temperature variations in the Altai region preindustrially, during the industrial period they found that only CO2 concentrations show a significant correlation with the temperature record. They did find agreement with the northern hemisphere (NH) temperature reconstruction of Scafetta and West (2007) in that they found that only up to approximately 50% of the observed global warming in the last 100 years can be explained by the sun. Note that this conclusion provides 50% as an upper limit to the explanatory power of solar variability, and this is for the full century. Therefore, for the last 50 years, this conclusion is still consistent with the IPCC (2007b) statement that “[m]ost of the observed increase in global average temperatures since the mid-20th century is very likely due to the observed increase in anthropogenic greenhouse gas concentrations.”

Therefore, to summarize: attempting to attribute late-20th century temperature change mainly to solar variability requires choosing a specific solar dataset, assuming a simplified model with different “fast” and “slow lag” responses based on timescales from a controversial paper, and assuming that the climate system is several times more sensitive to changes in solar irradiance (or other, non-radiative changes in the sun) than it is to changes in GHG forcing. All three of these assumptions are counter to the conclusions of the IPCC and CCSP assessments and not viewed as established conclusions in the literature. While science in this area will continue to evolve, our review did not uncover any compelling alternatives to the science represented in the assessment literature, and summarized in the TSD.
Ho Ho Hummmm.

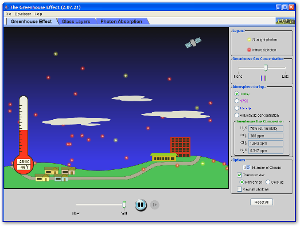
Greenhouse in a Java jar

While Ethon was out in Boulder pecking away, he thought it would be like nice to bring Eli a gift. The PhET project has a huge number of really cool (the Bunnies ARE nerds:) science simulations, among which is the greenhouse in a java jar, which, among other things lets you play with the level of greenhouse gases, the solar insolation, the clouds and more. Enjoy

As you change the conditions the temperature of the surface changes as it does naturally.

Wednesday, April 07, 2010

Muir Russell and the Wayback Machine


Eli has been thinking a bit about the Muir Russell Inquiry into the stolen Climate Research Unit Emails. One of the issues (if McIntyre and his ilk are about, when has it not been) is what sharing of data and methods is required by the act of publication. Now Eli is an OLD bunny. Maybe not quite so old that he wrote his thesis with a quill pen, but old enough that he did the drawings in India ink and lettered them with Leroy templates. He remembers when the copying machine was a rexograph, mimeographs being too expensive, and when you paid a couple of hundred bucks for the original and three carbon copies of your thesis. The original went to the university library, one copy to you, one copy to your adviser and the third to University Microfilms, who, well microfilmed it.

In those days you actually paid for reprints of your papers, because once the type was set, the offprints were cheaper than copying, and people actually sent you postcards from third world countries like England and Japan, begging for copies, which you mailed off, because you wanted to keep them coming to get the stamps to give to your kid brother, who was grateful for a nanosecond, and postage cost nothing or was paid for by the department.

There were NO data repositories, no hard discs, paper tape took a lot of room and magnetic tape was something you ooed and aahed about. This, as all things changed. As it changed journal requirements changed also. Today, Eli wandered into the depths of the library to look at some dead trees. Specifically Nature. Turns out that in 1996 Nature's requirements changed from

Nature requests authors to deposit sequence and crystallography data in the databases that exist for this purpose
those fields being the first to establish such data archives, to the current
Materials: As a condition of publication authors are required to make maerials and methods used freely available to academic researchers for thier own use. Supporting data sets must be made available on the publication date from the authors directly and by posting on Nature's web site, by depostion in the appropriate data base or on the internet.
Most other journals have much less stringent policies, and these too have changed over time. Data retention is another area where forever is no answer. In the US NIH policy is
Period of retention. Data should be retained for a reasonable period of time to allow other researchers to check results or to use the data for other purposes. There is, however, no common definition of a reasonable period of time. NIH generally requires that data be retained for 3 years following the submission of the final financial report. Some government programs require retention for up to 7 years. A few universities have adopted data-retention policies that set specific time periods in the same range, that is, between 3 and 7 years. Aside from these specific guidelines, however, there is no comprehensive rule for data retention or, when called for, data destruction.
Kings College (London) has a flow chart for the engineering bunnies where the recommendation is seven years for funded research and four for unfunded.

All this goes to the accusations against Phil Jones and the CRU for "destroying data". It's been clearly established that the CRU was never a data depository for data from the National Meteorological Services, but there has been plenty of noise that they had an obligation to plasticize every piece of paper in the place.

Nonsense. As Jones wrote:

No one, it seems, cares to read what we put up on the CRU web page. These people just make up motives for what we might or might not have done.

Almost all the data we have in the CRU archive is exactly the same as in the Global Historical Climatology Network (GHCN) archive used by the NOAA National Climatic Data Center [see here and here].

The original raw data are not “lost.” I could reconstruct what we had from U.S. Department of Energy reports we published in the mid-1980s. I would start with the GHCN data. I know that the effort would be a complete waste of time, though. I may get around to it some time. The documentation of what we’ve done is all in the literature.

If we have “lost” any data it is the following:

1. Station series for sites that in the 1980s we deemed then to be affected by either urban biases or by numerous site moves, that were either not correctable or not worth doing as there were other series in the region.

2. The original data for sites for which we made appropriate adjustments in the temperature data in the 1980s. We still have our adjusted data, of course, and these along with all other sites that didn’t need adjusting.

3. Since the 1980s as colleagues and National Meteorological Services (NMSs) have produced adjusted series for regions and or countries, then we replaced the data we had with the better series.

In the papers, I’ve always said that homogeneity adjustments are best produced by NMSs. A good example of this is the work by Lucie Vincent in Canada. Here we just replaced what data we had for the 200+ sites she sorted out.

The CRUTEM3 data for land look much like the GHCN and NASA Goddard Institute for Space Studies data for the same domains.

Apart from a figure in the IPCC Fourth Assessment Report (AR4) showing this, there is also this paper from Geophysical Research Letters in 2005 by Russ Vose et al. Figure 2 is similar to the AR4 plot.

I think if it hadn’t been this issue, the Competitive Enterprise Institute would have dreamt up something else!

Yes indeedy

Tuesday, April 06, 2010

McLean, de Freitas and Carter throw Soon and Baliunas under the bus

One of the joys of talking to idiots, is sooner or later they commit crazy. John McLean is giving lessons over at the Drum, as Eli and Deltoid and a few dozen others are pointing out, and the McKitrick machine is just starting to churn, somewhat belatedly, given how much fun McLean is providing. Of course, every carny needs a few rubes for our snarking pleasure.

Anyhow, the latest nonsense involves publishing long whines, and M and the three amigos don't disappoint. They need a visit to Rick Trebino's school of editorial disassembly, mostly they need to learn that taking yourself seriously is not an excellent career move for clowns.

However, there IS gold in them thar plaints. You know that McLean, de Freitas and Carter are reaching new heights (they must be flying on SOMETHING colorful to commit such spectacular intellectual suicide) when they keep harping about

  • Unprofessional publication of Foster et al.’s critique on the Internet, in AGU journal format, before it had been considered or accepted for publication by AGU.
  • Questionable editorial inaction, in editor-2 not rejecting the Foster et al. critique on grounds of its prior publication and formatting, both in direct
which goes back to the fact that the formatted preprint was posted early on by Kevin Trenberth .

Hmm, where has Eli seen misleadingly formatted manuscripts. Oh Yes, "Environmental Effects of Atmospheric Carbon Dioxide". Original by A and Z Robinson, the alpha and omega of the Oregon Institute of Science (none of that please) and Medicine (JPANDS loves em), and Sallie Baliunas and Willie Soon of the Harvard-Smithsonian Center for Astrophysics.

That manuscript, of course, lead the US National Academy of Sciences to issue a statement
The NAS Council would like to make it clear that this petition has nothing to do with the National Academy of Sciences and that the manuscript was not published in the Proceedings of the National Academy of Sciences or in any other peer-reviewed journal
and when de Freitas (amazing how Chris was for this sort of thing before he was against it:) finally shoe horned it into Climate Research, why half the editorial board resigned

Newer version with Noah R and not Zach and Sallie taking a powder here

Who knew.

Thanks to the copy editors. Mistakes corrected

Monday, April 05, 2010

Ethon Can Retire Part V: Roger Pielke Jr. and the EPA

Ethon had joined Eli in his new retirement village and they were sitting outside enjoying their cool beverages and reading the US EPA responses to challenges to its Endangerment Finding for increasing CO2 concentrations. Eli was reminiscing how he and Nils Simon had shown that Ethons source of little liver treats had made a living by omitting a whole lot of important things from his discussion of hurricane damage. As old buddies are often fond of doing, they chortled when reading Comment 7-5 and the Response

Comment (7-5):
A commenter (3136.1) states that the TSD does not mention that there have been no observed increases in trends of flood-related damages while global temperatures have increased over the past century. The commenter cites Downton et al. (2005), and argues that this paper indicates that there is no detectable increase in flood losses in the face of rising temperatures when population growth and wealth are accounted for. The commenter argues that given this evidence, climate change effects on flood-related damages should not be used as a basis for determining endangerment.

Response (7-5):
We find that the commenter has misinterpreted the findings of the Downton et al. (2005) paper. This study “presents results of a reanalysis of NWS flood damage estimates from 1926 to 2000. It describes National Weather Service methods of collecting flood damage estimates, explains some of the limitations and problems in the data, and recommends appropriate methods of interpretation and use.” After careful review, we do not find evidence within this study which suggests that increases in intense precipitation have resulted in no increases in flooding, as suggested by the commenter. In fact, this paper does not directly analyze the relation between precipitation intensity and flood frequency and/or intensity. Rather, Downton et al. (2005) [Downton, W.M., J.Z.B. Miller, and R.A. Pielke Jr. (2005). Reanalysis of U.S. National Weather Service Flood Loss Database. Natural Hazards Review 6:13-22] analyzes trends in flood damage data and identifies sources of error in the damage estimates. At a national level, the study finds that “Total damage and per capita damage have increased significantly since 1934 (statistically significant at a 95% confidence level). On the other hand, damage per unit wealth has declined slightly (although the trend is significant only at an 85% confidence level).” However, no correlation or connection is analyzed with changing precipitation intensity or amount.

Regarding weather-related damages such as flooding, we note the conclusions of the U.S. Climate Change Science Program (CCSP) (2008i) which state that “Numerous studies indicate that both the climate and the socioeconomic vulnerability to weather and climate extremes are changing (Brooks and Doswell, 2001; Pielke et al., 2008; Downton et al., 2005), although these factors’ relative contributions to observed increases in disaster costs are subject to debate. For example, it is not easy to quantify the extent to which increases in coastal building damage is due to increasing wealth and population growth in vulnerable locations versus an increase in storm intensity. Some authors (e.g., Pielke et al., 2008) divide damage costs by a wealth factor in order to ‘normalize’ the damage costs. However, other factors such as changes in building codes, emergency response, warning systems, etc. also need to be taken into account.

At this time, there is no universally accepted approach to normalizing damage costs (Guha-Sapir et al., 2004). Though the causes of the current damage increases are difficult to quantitatively assess, it is clear that any change in extremes will have a significant impact.” These CCSP conclusions are consistent with Downton et al. (2005) which states that “Although flood damage fluctuates greatly from year to year, estimates indicate an increasing trend over the past century (Pielke and Downton 2000). To understand increasing damage and assess implications for policy, decision makers need to recognize the influences of climate, population growth, land use, and policy on trends in damage. An increase in flood damage due to changing climate would probably require different policy actions than would damage increases due to implementation of flood policies.”

We also note that monetized flood-related damages, as studied by Downton et al. (2005), are only one type of flood-related effect on health and welfare. Other important damages discussed in the TSD include increased morbidity and mortality, adverse impacts to wildlife and habitat loss, impaired water quality, and other effects that are generally not included in flood damage estimates. To provide additional context regarding the future impacts of climate change on flooding, several studies reviewed and cited by Kundzewicz et al. (2007) indicate that increases intense precipitation will result in adverse impacts:

* Choi and Fisher (2003) estimated the expected change in flood damages for selected U.S. regions under two climate-change scenarios in which mean annual precipitation increased by 13.5% and 21.5%, respectively, with the standard deviation of annual precipitation either remaining unchanged or increasing proportionally. They used a structural econometric (regression) model based on time series of flood damage and population, wealth indicator, and annual precipitation as predictors. They found that the mean and standard deviation of flood damage are projected to increase by more than 140% if the mean and standard deviation of annual precipitation increase by 13.5%. The estimates suggest that flood losses are related to exposure because the explanatory power of population and wealth is 82%, while adding precipitation increases the explanatory power to 89%.

*Another study examined the potential flood damage impacts of changes in extreme precipitation events using the Canadian Climate Centre model and the IS92a emissions scenario for the metropolitan Boston area in the northeastern United States (Kirshen et al., 2005). They found that, without adaptation investments, both the number of properties damaged by floods and the overall cost of flood damage would double by 2100 relative to what might be expected with no climate change, and that flood-related transportation delays would become an increasingly significant nuisance over the course of the century.

After review of the studies submitted during the public comment process, we find that literature presented in the TSD is an accurate and reasonable summary of current scientific understanding. See the Findings, Section IV.B, “The Air Pollution Is Reasonably Anticipated to Endanger Both Public Health and Welfare,” for our response to comments on how the Administrator weighed the scientific evidence underlying her endangerment determination.
Stay tuned to more adventures of your EPA.

Sunday, April 04, 2010

The CRU is not pleased with Steve McIntyre

In it's response to the Muir Russell commission, the CRU discusses the Yamal imbroglio

Our work later became the subject of widespread misrepresentation in the media, amounting to hysterical and defamatory reporting of a posting on the “Climate Audit” website, managed by Steve McIntyre. McIntyre produced an alternative chronology omitting many of the modern sites we had used and replacing them with data from another single location. This alternative chronology differed markedly from our chronology during the late 20th century. McIntyre implied that this is evidence that Briffa had improperly selected certain tree-ring data, specifically in order to manufacture a false impression of recent enhanced tree-growth in the Yamal region.
This assertion is entirely false. On the contrary, McIntyre’s omission of the data we had validly used and its substitution with data showing an atypical pattern of tree-growth variations in the region, itself constitutes a biased analysis. A detailed refutation of McIntyre’s implied accusations (Briffa and Melvin 2009) was posted on the CRU website (http://www.cru.uea.ac.uk/cru/people/briffa/yamal2009/) on 27th October, 2009. A copy is included with this submission. This includes details of a recent re-analysis we made of the Yamal chronology, in response to the posted criticisms. In this re-analysis we incorporate additional living-tree data made available by Rashit Hantemirov at our request. The inclusion of the additional samples and the use of improved statistical processing techniques produced only small differences in the tree-growth pattern (see Figure 1.3 below). From this it is clear that our original work was sound and where the CRU Yamal chronology is incorporated in multi-proxy reconstructions, the choice of which version will not significantly affect the outcome of the final reconstruction.Figure 1.3 – Extracted from Briffa and Melvin (2009)
Comparison of published and reworked Yamal chronologies. This Figure shows the two earlier versions of the Yamal RCS larch chronology in red (published in Briffa, 2000) and blue (Briffa et al., 2008) compared to the new version, based on all of the currently available data (Yamal_All) for the original (POR, YAD and JAH) sites and including the additional data from the KHAD site (in black). Tree sample counts for this ‘new’ chronology are shown by the grey shading. The upper panel shows the data smoothed with a 40-year low-pass cubic smoothing spline. The lower panel shows the yearly data from 1800 onwards. All series have been scaled so the yearly data have the same mean and standard deviation as the Yamal_All series over the period 1-1600.
And, oh yes, they don't much like Fred Pearce neither
In an article in the Guardian, published on 3rd February, 2010, Fred Pearce provides a misleading account of an email relating to this affair. Professor Tom Wigley wrote to Phil Jones on the 5th October, 2009, expressing some disquiet that our Yamal analyses might be suspect, from which it is obvious that he had been misled by reading Mcintyre’s posts. Pearce’s article is written in such a way as to strongly imply that Wigley had read the CRU response to this issue (posted on 27th October, 2009) and was dissatisfied. In reality, Wigley’s email predates the response by 3 weeks and after he did read it he was fully satisfied, as he explicitly communicated in a later email to a colleague on 3rd February 2010 (http://www.cru.uea.ac.uk/mr/Wigley_email.pdf).
Which James Randerson might be interested in reading
Date: Wed, 03 Feb 2010 15:46:23 -0700
From: Tom Wigley

I can see why you are concerned about Fred’s latest piece in The Guardian. It does look as though he has deliberately chosen dates to make it appear that I was dissatisfied with Keith’s response. Either that or it was a genuine mistake -- or he is simply ignorant and has not seen the full response. Whatever, he really should write an apologetic P.S. to his piece.

I was completely satisfied with Keith’s response. Not only did it answer all of my concerns and questions, but it also shows that the real villain here is McIntyre (although Keith is careful not to draw that conclusion).

I am enclosing a chronology, and my own summary of the issue. Pearce is a good science writer, but he has really dropped the ball in his series of Guardian articles over the last few days. Sad.

Best wishes,
Tom.
Oh nos! Steve is such an innocent little lamby.

CRU Inquiry Report submissions

Again too late;) Submissions to the Muir-Russell report closed March 1, however they are now being published at the Inquiry Web Site. The distribution of comments appears much more even than for the Parliament Science and Technology Committee Inquiry

An issue that is going to be important, is as Ray Bradley and others point out

You expressly note that your inquiry “is about proper scientific and FOI procedures and data handling within CRU” and not about “the fundamental science of climate change” yet most of the questions you pose are indeed quite specific about scientific issues, some of which are topics of current research by a number of individuals.
He goes on after answering the Inquiry's question about how important the assertion of “unprecedented late 20th century warming" is
As noted earlier, this question has no bearing whatsoever on your brief to examine, “..whether there is any evidence of the manipulation or suppression of data which is at odds with acceptable scientific practice … CRU’s policies and practices for acquiring, assembling, subjecting to peer review and disseminating data and research findings, …CRU’s compliance or otherwise with the University’s policies and practices regarding requests under the Freedom of Information Act (the FOIA) and the Environmental Information Regulations (the EIR) for the release of data , or … the appropriate management, governance and security structures for CRU and the security, integrity and release of the data it holds”
Perhaps, the Science and Techology Committee was right, that there should only be a single committee looking into all issues. Bradley also points out that
I note (in the FAQ section of your web site) that you have not yet read all the emails, and do not appear to find such a task essential. If that is indeed so, let me point out that the Associated Press reported the total volume of stolen material was about 1 million words, of which only a few sentences have raised any questions. I would therefore remind you of the statement attributed to Cardinal Richlieu:

“If you give me six lines written by the most honest man, I will find something in them to hang him”.

Please bear that in mind. The theft was a political act, and your inquiry should be fully aware of the context in which you are operating.
The Climate Research Unit has a somewhat similar point of view
The Climatic Research Unit, at the University of East Anglia, welcomes the opportunity to answer the questions asked of it by the Independent Climate Change E-mail Review. It recognises that the theft of e-mails in November 2009 has led to many questions in the media and the blogosphere. It accepts that there are justifiable questions which may be asked, following the publication of the stolen e-mails which represented a tiny fraction of those received and sent by the Unit during the period in question. However, the justifiable questions have been swamped, we believe, by ill-informed opinion and distortion.

Consequently, we are pleased to be able to address both the reasonable and informed concerns and the greater number of misinformed or distorted concerns through the medium of our answers to the specific questions asked of the Unit by the Independent Climate Change Email Review.

We note that, in some instances, the questions stray into areas which appear to be beyond the issues raised by the stolen e-mails, but – similarly – we welcome the opportunity to respond to them.
Nick Barnes had an interesting submission detailing the interplay between GISSTEMP and the Clear Climate Code Project
For this reason, many software professionals encountering science software for the first time may be horrified. How, they ask, can we rely on this crude software, developed in primitive conditions - by amateurs, working with such poor tools and such poor understanding of the field? This is a common reaction to GISTEMP, and is exactly the reaction which many critics have had, some very publicly, to the software published with the CRU emails. Such critics do have a point. Science software should be better than it is. Scientists should be provided with more training, and more support. But consider the uses to which science software is put. Most
software written by scientists:

* consists of tiny programs;
* which will only ever be run a small number of times;
* over the course of a few weeks as it is being developed;
* by the scientist who wrote it;
* on data gathered by that scientist's team;
* concerning a scientific field in which that scientist is expert;
* to perform data processing on which that scientist is expert; and will be discarded, never to be used again, as soon as the paper containing the results is accepted for publication.

In comparison, commercial software has a huge range of complex requirements, which are completely irrelevant to most science software: usability, robustness, flexibility, maintainability, size, speed, compatibility, portability, consistency, documentation, and so on. Much of the software industry, and the art of computer programming, is motivated by and devoted to meeting these requirements (which, even so, it often utterly fails to do). The tools and skills which I have spent my professional life mastering are of little consequence to the working scientist, who is simply trying to get the charts ready for his or her next publication.
Comments?

Saturday, April 03, 2010

Eli can retire Part IV - Essex, Beenstock, Reingewertz and VS take it on the chin

Continuing Rabett Run's excerpts from the US EPA responses to challenges to its Endangerment Finding for increasing CO2 concentrations, Eli has it in for Essex, Beenstock, Reingewertz (really go to Our Changing Climate for this) and VS, Bart's little Mrs. Calabash.

Comment (2-26):
A commenter (3722) suggests that average global temperature is not an adequate “starting point” as an indicator of climate change “[c]onsidering the multitude of physical processes that control climate.” The comment indicates that “global temperature systems are not homogeneous, and are indeed characterized by large differences and variability.” The comment refers to Essex et al. (2007), who conclude “Physical, mathematical, and observational grounds are employed to show that there is no physically meaningful global temperature for the Earth in the context of the issue of global warming to support this notion.”

Response (2-26):
We have reviewed the paper by Essex and considered the commenter’s view regarding the usefulness of global temperature as a “starting point” and we disagree that it is not a useful indicator. We note that the TSD does not rank the importance of any individual indicator or suggest that global average temperature is the most important indicator. Rather, it summarizes the scientific literature on a large set of indicators (including changes in sea level and ocean heat content, glaciers, snow cover, precipitation, and a large number of physical and biological systems).

With respect to the Essex et al. study, the authors claim that “physical, mathematical, and observational grounds are employed to show that there is no physically meaningful global temperature for the Earth in the context of the issue of global warming.” We do not dispute that a single global average temperature may not be particularly meaningful to understanding global warming and concur that global temperature systems are not homogeneous. But Essex et al. are neglecting the fact that climate scientists are not particularly interested in a single average value, but rather the change or variation in temperature expressed as anomalies over time at a range of spatial scales, from local to regional to global. Analysis of temperature anomalies is a legitimate, extensively peer-reviewed, expertly assessed methodology for understanding temperature trends at all scales.

Thus, the TSD appropriately summarizes the literature and that its discussion of global temperature is reasonable, informs our understanding of climate change, and is consistent with the scientific literature.
Comments?

Friday, April 02, 2010

Eli got video

John Beddington, the UK government science advisor on climate change and the IPCC


Mike MacCracken and Steve McIntyre on CNN


the transcript is here towards the bottom

Thursday, April 01, 2010

Advanced Trolling 101

Continuing Eli's course on trolls, we have Fran Barlow over at Deltoid commenting on a subspecies of the concern troll, the tone troll

One of the interesting subsets of the concern troll John is the tone troll. The tone troll need not profess agreement with the consensus but pleads for more civility in language and more respect for other points of view.

We may all disagree, the tone troll maunders, but surely we can all agree to be polite and show each other respect.

Now who could possibly object to that? Of course, this merely opens the door to allowing other invading spammers and trolls simply posting and reposting their talking points as if they have not yet been civilly dealt with. It can't possibly rein in those trolls who come to the group with outlandish and utterly unfounded slanders -- which those of us who see them for what they are are supposed to dignify with counter-argument.

People who post with a reckless disregard for the truth, who lack the seriousness and discipline to anticipate and address likely objections and yet hold themselves out as experts have not earned respect or the right to be dealt with civilly, IMO.

The Golden Rule applies. If you are constructively rude to others, then others are perfectly entitled to respond in quite the same way. It may or may not be wise in practice to do so. Some trolls take pleasure in nuking discussion by making the thread all about them. Not uncommonly, they declare thinly disguised stupidities as bait for those willing to wander off at a tangent. This is all part of the culture war that the trolls for the filth merchant position do.

Nevertheless accepting lectures from concern and tone trolls ought not to be something those of us who take ideas seriously ought to endure.

As the JGR editor said
while I appreciate the value of "taking the high road", I do not object to emphatic statements that conclusions are incorrect. Strong language is needed sometimes when errors must be corrected.
An eye for an eye, a tooth for a tooth.

UPDATE: Fran continues

If people want to hurl epithets, then while I personally see little value in this for the group, I see greater potential systemic harm in attempts to restrain them. If the person moderating the blog doesn't like it, let that person act as he or she sees fit.

A person hurling epithets must reckon with the possibility that their substantive observations, worthy as they may be, will be deprecated accordingly by some whose respect they would have. That ought to be a sufficient restraint.

One hears persistent objections from the trolls that any robust rejection of the sub-intellectual nonsense some post here in the service of their delusions over the etiology of the climate anomaly amounts to a new iteration of Stalinist patronage of Lysenko or some equivalent. The implicit idea that one could debate tone with a violently repressive autocracy, or that what happens in the blogosphere is comparable is not merely absurd but offensive to anyone who has suffered coercion for dissent.

So FWIW, I don't favour substantial discussions over the tone in which we should answer apparent trolling, even though, paradoxically, I now seem to be in such a discussion.

For many reasons, Eli thinks that silly is a better word to use to describe trolls than stupid.

Go there. Right now!

Sometimes, gems are buried in the comments. Thingsbreak directs us to an important development at James' Empty Blog. After James donned the humble cloth cap:

Eli, I don't think my organ really rates as much of a bully pulpit :-)
Thingsbreak interjected
Don't be too sure!
Do what you are told, follow the bottom link to discover the power of the humble blogs

:)

Something more on the UK ICO jihad against the University of East Anglia and Phil Jones from Desdemona Depairs. Some other interesting things over there too

Consider this an Eli Reads thread

Eli can retire: Part III - Svensmark circles the drain

One of the bunnies said why bother posting these, the blogs have been all over this stuff. . . Well, for one thing Eli doesn't have to write them, for another, picking out the gems is fun and for anther, if anyone is looking for a good answer to one of the everbrowns, well Eli is happy to oblige. Today it's Svensmarks turn in the barrel, and there is a neat, new point down there in bold.

UPDATE:
But before we start, in the comments, the AGW Observer, Ari Jokimäki, points to his article on a 2007 paper by Evan, et al., which claims that viewing angle has a strong effect on the cloud data (ISCCP) that Svensmark and Friis Christensen used. If corrected, most of the variation in cloudiness with time vanishes, and so does any claimed correlation with cosmic ray flux. UPDATED: The Evan result is not without its doubters, a summary is here but there is more reading to do. On the one hand there are problems with the ISCCP data set, on the other the problems may not be as deep as the critics maintain

Back to Eli's post

Comment (3-36):
Many commenters (0153, 0245, 0509, 0591, 1017.1, 1187, 2953, 3722, 3729.1) claim that temperature is better correlated with solar activity patterns than with greenhouse forcing, some of whom reference researchers such as Svensmark or Shaviv that attribute the mechanism not to solar irradiance but rather solar wind or solar-magnetic flux (2917, 3205.1, 3324.1, 4632, 5058) and interactions with cosmic rays seeding low-lying clouds (0542, 0646, 0798, 1616.1), or length of solar cycles (0543) or sunspots (1219.1).

One commenter (7031) indicates that solar impacts on climate have received scant research attention and are minimized in the IPCC Fourth Assessment Report (2007a) and the climate model community, even though the IPCC authors rank the level of scientific understanding of solar-climate interactions as very low. The assumption is that variations in TSI are the only significant solar impact on global climate. The commenter also posits:

------------------------------------------
Recent studies have shown strong correlations between solar-modulated cosmic ray fluxes and low-level cloud cover and its subsequent impact on global temperatures. Experimental verification of a cosmic-ray cloud seeding mechanism was recently completed by Svensmark et al. [1997], and the CLOUD (Cosmics Leaving OUtdoor Droplets) experiments at CERN (the European Organization for Nuclear Research) over the next few years will provide definitive measurements of cloud seeding by cosmic rays.
---------------------------------------

The commenter concludes it is clear that solar variations have much larger impacts on global climate than what is estimated based solely on TSI variations.

One commenter (3446.2) requests that the TSD include a rigorous presentation of sunspot activity and temperature over the past century, and notes objection to the lack of sunspot discussion in Karl et al. (2009). Another (3397) requests more discussion of solar activity as a climate forcer.

Response (3-36):
The contention that cosmic rays could provide the mechanism by which changes in solar activity affect climate is not supported by the literature. Solomon et al. (2007) address this topic, noting that “the cosmic ray time series does not appear to correspond to global total cloud cover after 1991 or to global low-level cloud cover after 1994.” More recent research continues to question the ability of this mechanism to play a significant role in climate change. Pierce and Adams (2009) use calculations to show that potential impacts on clouds from cosmic rays and “conclude that the hypothesized effect is too small to play a significant role in current climate change.” Erlykin et al. (2009) found that the evidence showed that connections between solar variation and climate were more likely to be mediated by direct variation of insolation rather than cosmic rays, and concluded: “Hence within our assumptions, the effect of varying solar activity, either by direct solar irradiance or by varying cosmic ray rates, must be less than 0.07 ◦C since 1956, i.e. less than 14% of the observed global warming.” Carslaw (2009) and Pittock (2009) review the recent and historical literature in this field and continue to find that the link between cosmic rays and climate is tenuous, though they encourage continued research.

The CLOUD experiments at CERN are interesting research but do not provide conclusive evidence that cosmic rays can serve as a major source of cloud seeding. Preliminary results from the experiment (Duplissy et al., 2009) suggest that though there was some evidence of ion mediated nucleation, for most of the nucleation events observed the contribution of ion processes appeared to be minor. These experiments also showed the difficulty in maintaining sufficiently clean conditions and stable temperatures to prevent spurious aerosol bursts. There is no indication that the earlier Svensmark experiments could even have matched the controlled conditions of the CERN experiment. We find that the Svensmark results on cloud seeding have not yet been shown to be robust or sufficient to materially alter the conclusions of the assessment literature, especially given the abundance of recent literature that is skeptical of the cosmic ray-climate linkage reviewed in the previous paragraph.

Therefore the TSD summary of the assessment literature on this issue is well founded: that the lack of a proven physical mechanism and the plausibility of other causal factors make the association between galactic cosmic ray-induced changes in aerosol and cloud formation controversial.
Comments?