Hansen 1988 Retrouvé

Celebrating the 30th anniversary of the 1988 publication of Global climate changes as forecast by Goddard Institute for Space Studies three-dimensional model Hansen, J., I. Fung, A. Lacis, D. Rind, S. Lebedeff, R. Ruedy, G. Russell, and P. Stone Eli along with others (like Gavin Schmidt, Nick Stokes and others) Eli went back and took a look at what had been discussed in these parts as well as those. There are a lot of very good people who contributed to that paper, so it henceforth hereabouts shall be known as HFLRLRRS.
One of the most important things is that the current discussion focuses on the predictions of forcing as well as outcomes. The first is more or less ecomonics, the second physics.
That being the case, HFLRLRRS were pretty good on both. Back in 1988 Hansen described the choice of scenarios
For the future, it is difficult to predict reliably how trace gases will continue to change. In face, it would be useful to know the climatic consequences of althernative scenerios. So we have considered three scenarios for future trace gas growth, shown on the next viewgraph.
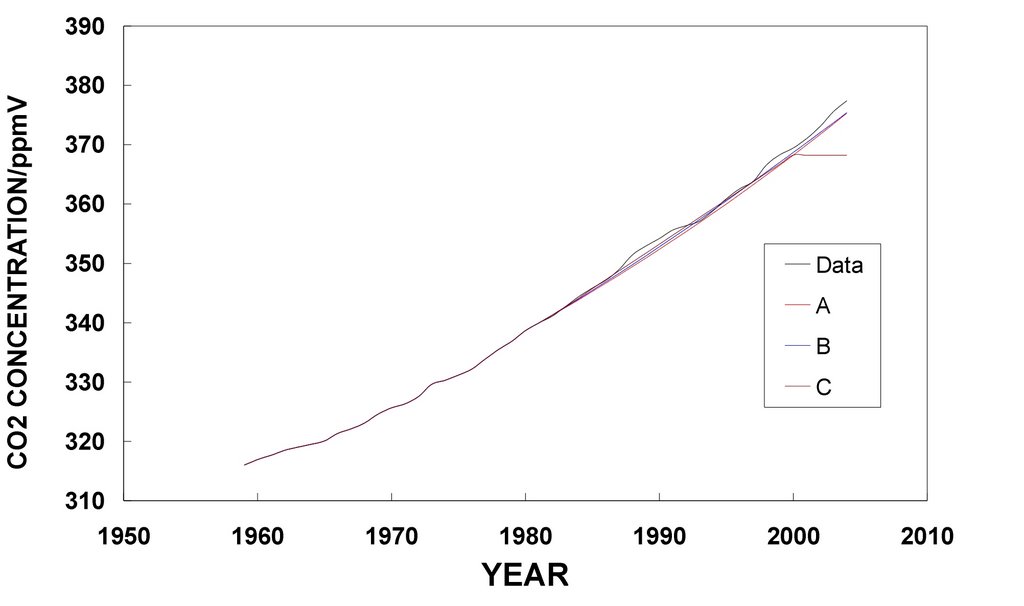
Scenerio A assumes the CO2 emissions will grow 1.5 percent per year and that CFC emissions will grow 3 percent per year. Scenerio B assumes constant future emissions. If populations increase, Scenerio B requires emissions per capita to decrease.
Scenerio C has drastic cuts in emissions by the year 2000, with CFC emissions eliminated entirely and other trace gas emissions reduced to a level where they just balance their sinks.
These scenarios are designed specifically to cover a very broad range of cases. If I were forced to choose one of these as most plausible, I would say Scenario B. My guess is that the world is now probably following a course that will take it somewhere between A and BIn 2006, Eli pointed out that the CO2 prediction was eerily accurate
and that since CO2 is the predominant forcing differences in the other greenhouse gas forcings will have lesser effects
It shows that many details in emission scenarios are unimportant, or rather that false estimates in one direction are most likely going to be cancelled by false estimates in the other for a different forcing agent, and that on average the scenarios should be useful for larger periods.
Which is what happened using the illustration from Real Climate

A neat thing in HFLRLRRS which has not been commented on much were the color coded maps of temperature anomalies by decade in the future which can be compared to measurements. Eli finds this much more interesting and informative about the early GISS model than the time one dimensional variation of averate global temperature change. Comparing the result for the 2010s with measurements between 2014-2016 show that HFLRLRRS captured the broad picture but was not perfect

Arctic amplification is clear in the model and 30 years later in the observation. Otoh, the Antarctic in the model is clearly too warm as is the Arctic south of Greenland. The third pole (the Tibetan Highland is too warm also. It would probably be better to map out more of the current decade wrt the El Nino - Southern Oscillation, 2016 being a monster El Nino, but the period also includes about a year of La Nina.


4 comments:
I think that Hansen88 needs a forcing correction per ESRL AGGI ...
https://www.esrl.noaa.gov/gmd/aggi/aggi.html
https://www.esrl.noaa.gov/gmd/aggi/aggi.fig2.png
https://s3-us-west-1.amazonaws.com/www.moyhu.org/2018/06/gavin1.png
CO2 is close, between A and B
N2O is below A and B and above C (say ~ halfway between A and C)
CH4 is below C in its entirety
CFC11 is close to C but slightly below C for future projection
CFC12 is very close to C
Some groups include O2 (ozone) which gives a CO2e somewhere north of 500 ppmv today.
JC@CE has a post by McKitrick and Christy and they suggest not making the forcing adjustment ...
"Second, applying a post-hoc bias correction to the forcing ignores the fact that converting GHG increases into forcing is an essential part of the modeling."
Which actually supports making a forcing correction, use the forcing that actually happened, not Hansen's higher than actual forcing estimates. As the models are quasi-linear to begin with in the 1st place.
What would be interesting (to Eli) to compute would be the model interannual variability for the 2010s compared to that of the control run.
You might find this interesting: Yettella, et al, 2018, "An Ensemble Covariance Framework for Quantifying Forced Climate Variability and Its Time of Emergence".
Cross posting this from moyhu (Nick Stokes) ...
I've also been given the impression, by Gavin, several posts now, that the actual forcing to date are lower than the CMIP5 forcing as Gavin shows in this figure ...
http://www.realclimate.org/images/anthro_h88_eff.png
In 2006, Eli pointed out that the CO2 prediction was eerily accurate
Nice job- Eli, but why nobody calls liinear extrapolations eeiry when they beat apocalyptic predictions on accuracy is a semiotic puzzlement.
Post a Comment