An Oldie But Goodie - J.S. Sawyer on the Greenhouse Effect and CO2

In the continuing quest to find excellent descriptions of the greenhouse effect, Eli has come across J.S. Sawyers Nature article from 1972, Man Made Carbon Dioxide and the Greenhouse Effect, which was commented on by Skeptical Science and warehoused (bunnies can read it there) by the Weasel. Ray Pierrehumbert and David Archer included it in their climate change reader. Nevelle Nicholls wrote an appreciation of Sawyer's ground breaking work in 2007 under the title of A Warning We Ignored 35 Years Ago, unfortunately just as valid today 45 years later.
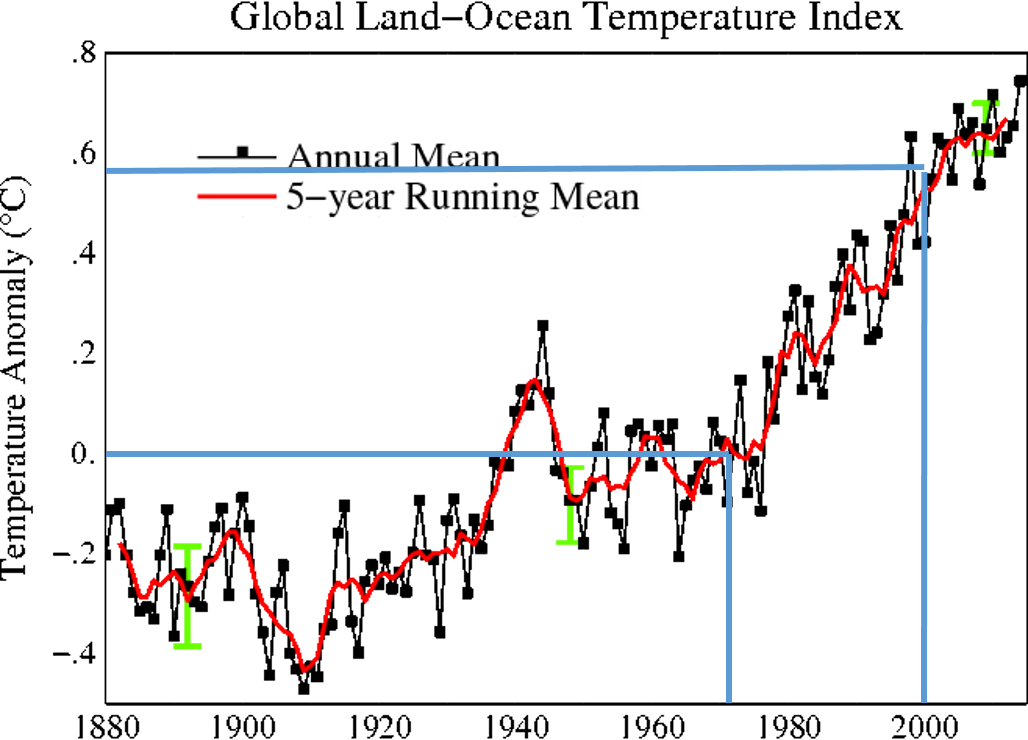
In four pages, Sawyer summarised what was known about the role of carbon dioxide in enhancing the natural greenhouse effect leading to warming at the earth's surface, and made a remarkable 28-year prediction of the warming expected to the end of the 20th century. His prediction can now be compared with what has been observed.Nicholls continues
While the IPCC (2007, ER) assessment devotes a volume to this subject, Sawyer could only conclude, after conceding that climate variations of only a fraction of a degree can have "considerable economic importance" that "although there may be no immediate cause for alarm about the consequences of carbon dioxide in the atmosphere, there is certainly need for further study".Sawyer's description of the greenhouse effect, as well as the rest of the paper, is masterful
Perusal of the IPCC volume devoted to the impacts of climate change on natural and human systems leaves one feeling far less sanguine than Sawyer was 35 years ago.
As carbon dioxide is one of the principal gases taking part in radiation exchange in the atmosphere and in the radiation of the Earth's heat content, a change in the content of carbon dioxide within the atmosphere is likely to influence the process. The chief effect of increasing carbon dioxide is that the gas which is radiating heat to space is found at a higher level in the atmosphere than before - the radiation from lower down in the atmosphere is absorbed by the extra carbon dioxide above and then reradiated to space. In the troposphere, at least, temperature decreases with height so the effective radiating temperature of the carbon dioxide becomes lower if the amount of the gas is increased and therefore less heat is radiated to space. Thus the additional carbon dioxide tends to act as a blanket which keeps the Earth warmer - the Earth has to get rid of the incoming radiation from the Sun, and the same amount can only be removed if the temperature of the atmosphere rises a little.He continues
An atmosphere at a higher temperature can hold more water vapour and the additional water vapour produces a similar blanketing effect to that produced by carbon dioxide. Manabe and Wetherald calculate that an increase of 100% in the content of carbon dioxide would increase the world temperature by 1.3 C if the water content of the atmosphere remained constant, but by 2.4 C if the water vapour increased to retain the same relative humidity. The increase of 25% of CO2, expected by the end of the century therefore corresponds to an increase of 0.6 C in world temperature, an amount somewhat greater than the climatic variations of recent centuriesHe did pretty well


15 comments:
2 points. 1. Hansen has posted a better version of the graph, at
http://www.columbia.edu/~jeh1/mailings/2016/20160926_BetterGraph.pdf
2."The chief effect of increasing carbon dioxide is that the gas which is radiating heat to space is found at a higher level in the atmosphere than before - the radiation from lower down in the atmosphere is absorbed by the extra carbon dioxide above and then reradiated to space. In the troposphere, at least, temperature decreases with height so the effective radiating temperature of the carbon dioxide becomes lower if the amount of the gas is increased and therefore less heat is radiated to space."
This is a confused description of the process, if only because the radiation temperature of the Earth is constant at ~255°K, set by the albedo and the solar input, with NO effect from CO2. The radiation level, measured 1600 times a day by radiosondes on weather balloons, is at the ~650hPa level, well inside the troposphere. Adding CO2 does indeed raise this level, and as its altitude increases, so does the surface temperature because they are connected by the lapse rate, ~6.5°C/km. The only assumption here is that the troposphere is well mixed (despite the clouds). Altocumulus lenticularis clouds sitting on mountain tops support the lapse-rate stability: the cloud stays put while the air moves through it, leaving the temperature stratification untouched while the air moves up and down.
The actual process is much more complicated in detail because the atmosphere is not a blackbody. We can talk about the optical depth (physically, the distance from the 'top of the atmosphere" to the radiating level), but it is extremely difficult to calculate it!
See
http://electromontis.net/JW/ClimateChange-PW.shtml#F13
Ferren,
Thanks for the link, and IEHO an excellent comment, but allow a demurral. The "radiative temperature of 255K" is really a result from a structureless model. What it is trying to say, is that the temperature of a black body emitting the total amount of energy absorbed by the Earth system would be 255 K. This says nothing about the spectrum of the emission or the three dimensional distribution.
The beauty of the "structureless model" is that it easy to understand, and it works astonishingly well. CERES satellite data read 239 W/m2 of radiated energy cf. the model's 240. Shell and Somerville's zonal model
http://journals.ametsoc.org/doi/full/10.1175/JCLI3373.1
shows that it gives a good fit from pole to pole.
Measuring the spectral energy distribution is possible, but much more expensive than total energy in hardware and time. Trying to calculate it is a job for masochists. As soon as one introduces back radiation into the argument, people like Peter L. Ward (who was a competent vulcanologist) start telling everybody's Senators that CO2 isn't the problem "because you don't stand by a cold stove to get warm". Peter misinterprets the Bohr-Einstein relation, insists that photons are only imaginary calculational entities, and that h·nu applies to field strength and doesn't need to be thought of as n·h·nu, so the problem is UV coming through the ozone hole "with 48 times the energy of CO2's IR". See:
https://ozonedepletiontheory.info/
(And don't confuse him with Peter D. Ward, the Medea Theory paleontologist at U. Wash!)
I know 3 people who have tried to sort PLW out, but he doesn't sort, stoutly maintaining that everyone thought Galileo was wrong too. But he tells politicians what they want to hear (and what Big Oil wants them to hear [I do not think he is paid for his efforts!]). The First Law and the lapse rate together form a simple model that any Senator ought to be able to understand. No politician is going to understand radiative exchange in a multilevel atmosphere, and while it is a fascinating intellectual challenge, I don't see that it adds anything persuasive to the debate. We have 19 (Democratic) Senators who understand something about climate change and global heating. That leaves 81 who need something that doesn't require graduate studies in physics.
My other simple middle-school model, business-as-usual with linear extrapolation of the 20th century into the 21st, gets us a 6.4°C increase by 2100, and I see that as (1) where the Senate is taking us, and (2) a culture breaker of the sort that has surprised 100 earlier civilizations and left their ruins in the sand.
Looks like next week is going to be interesting for the climate denialist camp. Lamar Smith is going to lead a hearing on Wednesday, 29 March. The presenters will include the usual denialist suspects, Curry, Christy and Pielke Jr., with Michael Mann representing the climate scientist side. Watch it and weep.
HERE's a commentary from last weeks SCIENCE about Rep. Smith's appearance before the Heartland Institute meeting. Smith's comments in the last paragraph are really hilarious, given Friday's meltdown of the Plumpian's grand promise to kill Obama Care...
OP: "A Warning We Ignored 35 Years Ago, unfortunately just as valid today 45 years later."
And just as valid as the warning from Arrhenius we ignored 120 years ago, since borne out while we watched.
Monckton has ersonded to the forthcoming curry-Mann confromtation by telling the world that the really relevant discipline in sorting it all out, is his new-found metier. Conoc Sections.
https://vvattsupwiththat.blogspot.com/2017/03/the-2347-year-gish-gallop.html
That link should be : .
After watching Monckton's Heartland show (thanks Russell), I must say he apparently has convinced himself that he is surely right about climate change. Trouble is, his "simple model" of a linear feedback system doesn't capture the real non-linear nature of the climate system. He presented a graph of temperature swings over the past Ice Ages, deftly claiming only a 2.5 K range about a mean, ignoring the obvious bi-stable characteristic which the graph clearly demonstrates, flipping from today's average to the minus 5 K lower range during Ice Ages. At an early stage in my "career" as an ME, I worked as a control systems analyst, while lacking the basic EE training. Still, I learned that such a bi-stable mode to be evidence of serious non-linear system. The climate system includes the phase changes of water, which appears in liquid, gas and solid forms at different latitudes and during different seasons. And, the water in the oceans acts as a giant thermal energy storage and transport mechanism, the effects of which do not appear in his model. There may be other, stable, modes, as the Earth warms beyond the range of the recent Ice Ages.
Here's wild thought. At the end of the Eemian, which was a bit warmer than the Holocene, the sea-level was higher, which might indicate considerable mass loss from Greenland. The Greenland ice cores did not extend beyond the Eemian. What if the transition back to Ice Age conditions depends on the melting of much of that Greenland ice sheet? This would reduce the elevation over Greenland and impact the atmospheric circulation, possibly allowing more moisture flowing from the Atlantic to build another ice sheet over Eastern Canada. Could it be that our CO2 warming and melting of Greenland lead to the start of another round of Ice Ages?
But, heck, the audience loved Monckton's show, so he won the field, so to speak...
@ E. Swanson -
that article on Lamar Smith was actually rather disquieting. So he's proposing the introduction of politically-acceptable science, its acceptability to be determined not by scientists but by criteria set by politicians. Why isn't he being called out for this Lysenkoist proposition?
E. Swanson --- Your 'wild thought' is not in accord with the facts. Better you read "The Long Thaw" by David Archer. Next serious attempt at a stade is not for another 100,000 years.
But, E. Swanson, we're currently in a round of ice ages...
It's just that we're plonked in an interglacial that we've now stretched out for a few millennia more than was scheduled.
But an "ice age" nevertheless. Unless of course we've pushed a tipping point...
Pleistocene = 'ice age'
Holocene = interglacial
Eemian = 'interglacial'
etc.
GrIS contribution to Eemian highstand SL (>6m above Holocene) is now thought to be about 2m, implying less mass loss from GrIS, quite a bit from WAIS and probably some from sectors of the EAIS - all at a GAT just 1 - 2C warmer than Holocene.
About the Eemian, thanks guys for the comments. I agree that the Earth's climate has been mostly Ice Age conditions since about 3.3 to 3.0 MA. Moving on...
I looked at Monckton's Heartland presentation again. Most of it was a re-hash of Monckton et al. 2015, ending with some points from the paper about their "simple model" for feedbacks, etc. He ends up by stating that he had found a fundamental error in the IPCC models for feedback, claiming that they should use absolute temperature, (K) not Delta T. With this comment, Monckton demonstrates that he has zero understanding of the math involved, in spite of his inflated claim to expertise at math.
The 2015 paper relies heavily on an earlier paper by Roe (2009), in which the author presents a simple linear feedback model, using Delta T. Indeed, Monckton et al. lifted graphs directly from that paper and the notion that a simple electronic analog circuit would suffice to describe the feedback in the climate system. I think that simple linear model was what was called a "perturbation model", which is based on the assumption that a complex, non-linear system can be approximated by a simple linear model under small variations around average conditions. Of course, as the results diverge far from the normal, that basic assumption is violated and the model results are flawed.
While I've not done the deep reading necessary, I think the IPCC's use of "feedback" is just a way of comparing the results of the various models. With a model, the analyst can separate the influences of each parameter, thus allowing a comparison between each model's results via the simple linear model. In the real world, actual values for the feedbacks can not be measured, thus a simple model can not include any such values. When I began working on control systems, we used analog electronic models involving dozens of amplifiers to model relatively simple dynamics with known physics but with non-linear characteristics, including threshold and hysteresis terms. A single amplifier with feedback could not begin to approximate such a system.
Monckton's scientific illiteracy was just what the Heartland and their fossil fuel industry supporters wanted. I seriously doubt that there were any people in the audience who understood how wrong Monckton was...
Here are some links:
Monckton's presentation See his model comments after t = 46 min., especially his graph at 52:30 min.
Monckton et al. (2015) Click on the PDF for download.
Roe (2009), Feedbacks, Timescales, and Seeing Red
A July 1, 2017 New York Times article says that "Chinese corporations are building or planning to build more than 700 new coal plants at home and around the world, some in countries that today burn little or no coal, according to tallies compiled by Urgewald, an environmental group based in Berlin. . . Overall, 1,600 coal plants are planned or under construction in 62 countries. . . The new plants would expand the world’s coal-fired power capacity by 43 percent. . . .Some of the countries targeted for coal-power expansion, like Egypt or Pakistan, currently burn almost no coal, and the new coal plants could set the course of their national energy policies for decades, environmentalists warn."
Obviously, the Chinese do not agree that "the science is settled" or they would not be doing this. Or perhaps they don't care.
Either way, the measures discussed in this article would seem to be futile.
Post a Comment