
Station of the day: Farmington ME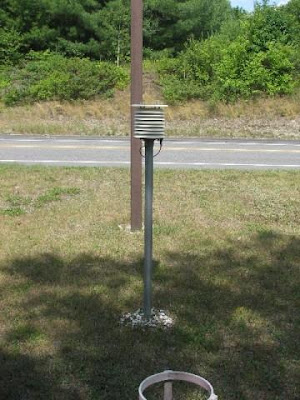
Courtesy of the Kristan Byrnes Science Foundation and Surfacestations.org
Another demonstration of the cooling bias in the USHCN temperature anomaly record.
Sunday, August 26, 2007
Subscribe to:
Post Comments (Atom)


64 comments:
Hey Rabett, rake in the face crowd says put temp graph on your site.
JohnS
There are some comments which require great self control to avoid the obvious answer, but we here at Rabett Run are up to the job.
For a rabett who cannot spell Sartre, you're sure getting uppity.You're telling the faith warmer story so stop your complaining and put the graph on your site.
JohnS
Sorry for the OT post, but I have chronicaled an honest to gawd email exchange between R. Courtney and a number of other high end deniers.
http://bigcitylib.blogspot.com/2007/08/great-balls-of-dry-ice-deniers-at-play.html#links
Maybe we should take UHI long time back into account:
http://www.crh.noaa.gov/mpx/history/Reading_Temp_Post_Office_MPLS_1890.jpg
From Minneapolis 1890.
At first I found the picture here:
http://npat.newsvine.com/_news/2007/01/31/546188-hydrologic-science-on-climate-change-thrown-out-by-nws-managers
good one, Rabbit. The only thing you are proving is that the entire stats could be all fucked up due to bad location.
Are you even too stupid to realize?
Perhaps JohnS should look at the temperature graph for Farmington himself before he leaps to conclusions -- and makes himself look like the fool he is.
Of course, he's not very likely to find the temperature data for that station on surfacestations.org
They seem to have a bias that prevents showing "good" stations that show a warming trend.
I enjoyed the heat images in earlier posts which suggest a lot of being made of nothing.
I wonder if someone could do the following rough and simple experiment on AC units that might equally show a lot of being made of nothing:
Place thermometers at varying distances from an active AC unit. Record the temperature measured at each thermometer over the course of a day. The assumption here being that a few meters spacing of thermometers is not going to make a lot of difference (unless for the bias of the AC)
Compare the daily trend from each thermometer to see how much bias the active AC has on temperature, and at what distance that bias disipates.
If surfacestation.org people are right then you should see thermometers within 2 meters showing a large warm bias compared to those over 5 meters away.
I would gladly do this experiment myself to find out, but living at such a high latitude I have no access to an AC unit that is active even half the day.
Although there's also the question of how installing an AC unit, even if it did cause a bias for nearby sensors, would cause temperature to gradually rise over the course of a decade rather than causing it to jump from the year it's installed.
"Although there's also the question of how installing an AC unit, even if it did cause a bias for nearby sensors, would cause temperature to gradually rise over the course of a decade rather than causing it to jump from the year it's installed."
There is an easy answer to your question:
As the temperature rises due to the proximity of the AC, the station manager at the surface station cranks up his AC more (because he thinks the temperature is actually going up, based on his own measurements) which causes his temperature monitor to record an even higher temp, which causes him to crank up his AC even more....
It's a classic positive feedback, leading to an upward temperature trend over time.
It's a constant battle, with the station manager trying to stay one step ahead of the game.
Clearly, the only way to stop this out of control upward spiral is to get rid of the idiotic station manager who thinks that just because his temperature monitor says 110 C, he needs to use his AC more (and more of them) than yesterday, when it only said 109 C.
The point is that
a. There are both negative and positive biases at the various USHCN network stations
b. Eli can find a lot more stations with negative biases in the surface station picture gallery.
c. The net effect will be to broaden the distribution, but not change the means (by anything meaningful).
d. That's what you get when you are too cheap to run your own system.
Yet another "good" site (Houlton, ME) that surfacestations.org shows the pictures for, but not the data.
That could not be because the data shows a warming trend, could it?
Surfacestations.org should either show temperature data with EVERY photo, or not show any.
Otherwise, it certainly gives the impression that they are cherry-picking.
That's not the impression they wish to convey, is it?
As the temperature rises due to the proximity of the AC, the station manager at the surface station cranks up his AC more (because he thinks the temperature is actually going up, based on his own measurements) which causes his temperature monitor to record an even higher temp, which causes him to crank up his AC even more....
Amen to that. This effect is especially pronounced in the high northern latitudes. Eskimos, unaccustomed to rising Arctic temperatures, have cranked up their air-conditioners in vain attempts to keep their igloos from melting. Unfortunately, the A/C exhaust has increased igloo melting in the vicinity of the exhaust heat, causing the panicked Eskimos to crank up the A/C even more. Since we know for a fact that NASA has set up its temperature monitoring stations right next to these igloo air-conditioners, alert AGW skeptics have had no trouble at all attributing the supposed "Polar amplification" to igloo A/C exhaust heat.
"the A/C exhaust has increased igloo melting in the vicinity of the exhaust heat,"
yes, but at least the inside of the igloo is still intact, since it is only the outside that is melting -- which makes it hard to keep them painted, I admit, but at least the whale blubber stays cool.
Given this now infamous "Melting Igloo problem" (one of the most intractable know to mankind), perhaps it makes more sense to design igloos that are like thermos bottles than to try to cut back on emissions.
Now that we have settled that issue once and for all, we can now move on to unifying gravity and quantum mechanics and/or explaining how String Theory is different from Spaghetti Theory.
JohnS is a mentally disturbed personality. Is there way to block him to write this site?
As far as I can see at surfacestations.org, they have a lot of sites both good and bad with temp graphs. Both Houlton and Farmington are from Kristen Byrnes, and it looks like she did not put graphs on any of the stations she uploaded from Maine, New Hampshire, Vermont, MA, and CT.
Maybe somebody should tell her.
The John S's of the world have their uses and are welcome to have their say
"they have a lot of sites both good and bad with temp graphs."
That's not the issue.
The issue is that they imply "good" sites show cooling while "poor" ones show warming, as pointed out by Tamino
"If you visit their site, the first pictures you’ll see — featured prominently on the home page — will be two stations in California, Orland and Marysville. They call Orland a “well maintained and well sited” location and Marysville as a “not-so-well maintained or well sited USHCN station”.
Poor Anthony. I don't think he ever recovered from the drubbing he received on Tamino's site.
This faux controversy over the biased choice of sites (Orland and Marysville, CA) on the main page of surfacestations.org has been addressed by Anthony Watts. These are two of the earliest sites which he documented personally. (And no doubt they were also chosen because their quality, good or bad, is extreme.)
These sites were readily done by Watts because he lives in Chico, CA, which is 50 miles from Marysville, and 20 miles from Orland.
No doubt he is happy that the "good" site showed cooling and the "bad" site showed heating. Naturally that makes him a bad person and a bad scientist. Of course, we know that no one here has a preferred outcome to this research.
Since his photographs can apparently be used to confirm the truth on either side, they are of course useful to the debate and should be welcomed.
These sites were readily done by Watts because he lives in Chico, CA, which is 50 miles from Marysville, and 20 miles from Orland.
I realize Tamino's post gets yer craw, Pitelli, but it's not about a the fact that he took photos of the two sites, but rather what he did with those photos.
But I can understand how Pitelli might be upset. I see the poor fella just got his own little butt kicked on Tamino's site
People put their best argument forward. And people put headlines near the top. For example, NASA has made claims about the "hottest year ever" and such. Which claims were "statistically insignificant" as we are only hearing now, and also wrong.
I don't see anything wrong with that (the headlining, if accurate) in the context of a blog or press release. Of course, one should be gracious about it when one is proved wrong (e.g., not call your opponents "court jesters").
I'm not upset. And I kicked butt at Tamino's site. That said, I wasn't making any ridiculous claims, like AGW isn't real. Merely that McIntyre has added to the scientific understanding.
Perhaps more the the point, surfacestations is providing data which has proven useful to both sides. His headlining aside, isn't that a good thing?
dwpittelli,
NASA GISS did not claim that 1998 was the hottest year in the US, nor that the difference between 1998 and 1934 was statistically significant.
The reported error had minor impact on the US trend, and zero impact on the global trend. NASA GISS did graciously acknowledge the error and make the necessary corrections in public, crediting Steve McIntyre.
That should have been the end of it.
Next idiots like Rush Limbaugh, Mark Steyn, grab hold of the story and start implying fraud. Other denialists used the MSM to, out of stupidity or worse, conflate US temperature with the global record to dispute global warming.
"Court jesters" is a most appropriate response.
Did NASA really say that 1998 was the warmest year on record in the US without qualifying it? I doubt it, given that the GISS publications say that 1998 and 1934 is a two horse race that is too close to call. If you look at Hansen's papers on this you would see that. Other people in the media have hung on this point but it hasn't been a feature of genuine scientific discussion.
RE: court jesters, if McIntyre wanted to avoid such a characterisation then he should have posted the differences between before and after in a graphical format in his blog. Such a comparison highlights the sheer (global) insignificance of the correction. Also, he should have made some kind of visible attempt to correct the gross mischaraterisation of his work ie. the global / USA confusion.
You say: "Perhaps more the the point, surfacestations is providing data which has proven useful to both sides. His headlining aside, isn't that a good thing?"
You seem to have missed the point of Eli's posts on cooling biases. The point is not so much that cooling biases exist, it is more that you can not use a photo to quantitatively charaterise them. In both of Eli's examples you have potential cooling biases, but in one you have a warming trend, and in the other you have a cooling trend. So, how have a bunch of photos advanced our knowledge of the quantitative temperature biases? What is the point of taking photos if there is no quantitative assessement of temperature biases to support the pervasive inferences of what the photos actually mean? None, as far I can see. Instead we have Antony Watts posting Orland and Marysville on the front page of his site with the clear inference that microsites have biased the data and caused the apparent warming. This is despite the fact that both locations display clear warming trends in the latter part of the 20th C.
If, on the other hand, somebody does the hard graft of actually examining temperature biases due to a whole range of factors and can apply it to observed temperature record trends and it correlates to the precise interdiction of said factors then we could talk business, but until then this entire endeavour lacks credibility.
Actually, to be fair to Steve, I see that he has started to make some form of graphical comparison. And who knows, maybe he has even emailed some of the more vocal right wingers that they have got it wrong, I would certainly hope so. He's certainly making the effort to acknowledge that some people have got it badly wrong now and has even gone on record to say as much, which can only be a good thing. I still think that if he'd used some graphs from the beginning rather than to use a leaderboard type comparison which lent itself to easy misrepresentation then the FUD storm might have been avoided.
If you're not tracking the amount of sunlight, and you're measuring air temp, whatever the condition (shade, sun, clouds) is what you're measuring. What bearing does shade have when you're measuring air that's shady or not?
This just proves there are factors not being taken into account for. One direction or the other.
UNDER a spreading chestnut tree
The village Rabett stands;
The Rabett, mighty smart is he,
Who knows it's cooler there;
The sun beats down upon the dumb
They fry where they stand;
== elirabett said: ==
=="The point is that
a. There are both negative and positive biases at the various USHCN network stations"==
Agreed. Why there are such numerous biases and violations of site standards remains unanswered though.
=="b. Eli can find a lot more stations with negative biases in the surface station picture gallery."==
But one picture in time doesn't prove anything. That's what you've said many times. You can not be implying that only your pictures have metadata value, can you?
=="c. The net effect will be to broaden the distribution, but not change the means (by anything meaningful)."==
You can refer me to the peer-reviewed literature backing up this claim?
=="d. That's what you get when you are too cheap to run your own system."==
The real issue is why the professionals have not enforced their own standards at surface sites that we have paid them too.
Perhaps civilian oversite of the climate network might be necessary.
Regards,
Paul S
The answer to why so many stations appear to have one or more non-standard elements is simple. First USHCN is part of the coop network, a cooperative network which means almost all of the sites are run by third parties, including TV stations, amateurs, etc. This also means that NOAA funds only a very small part of the network, that lots of stations are being run out of someone's back pocket, etc.
As to how many stations have negative bias', take a look at Tony Watt's surface station site. Lots of shadows, lots of sites with nearby trees especially to the south (BTW, winds passing through trees and blowing on the thermometer will also have a cooling effect.)
NOAA can't enforce a standard on sites it does not fund or own. That simple enough for you. The issue is you get the network you paid for. You want what you think will be a better site, go to the people who maintain each station and offer to support them.
Oh yeah, take a look at
== eli says: ==
=="NOAA can't enforce a standard on sites it does not fund or own. That simple enough for you."==
Oh it's simple enough all right.
Simple enough for people to understand that we do not have to give a lot of credibility to any of the data that the NOAA or NASA puts out about surface temps.
Thankfully, surface temperature records for much of the rest of the world (like Africa for instance) mean we don't need reliable surface temp records for the US anyways.
Regards,
Paul S
Paul, I think you need to take your calm pills and read a bit more.
Thanks for avoiding the subject altogether eli.
Photos don't matter, but your photos do. Check.
Failure to adhere to WMO standards is our fault. Check.
But don't worry, quality records, such as those found in Africa, or China, mean our surface site record is "robust". Check.
You're right, I do need some more calm pills. ;)
Regards,
Paul S.
No, no, no rabett you got it all wrong. Its Dano that needs the tablets. Paul S , no relation but fine last initial, is quite rational. Indeed quite a bit better than the person who downloaded on your library archive blog. Now there's a Dano effort.
JohnS
So, how's the state of Canadian stations?
In some sense, they're *way* more important than US-lower-48, since:
a) Canada is modestly bigger than US-lower-48; Canada+Alaska is maybe 15% bigger than lower-48.
b) Canada surely has many rural stations.
c) Because it's nearer the N. pole, Canada is a *much better* indicator of whether or not GW is happening (or not) in the way that climate scientists claim, i.e., that N. polar regions will warm faster. If global temperature goes up X, Canada (and Russia) will contribute the most to that, not the US (or Brazil).
Anyway, why aren't people agitating to see more GISS-like graphs for Canada (and Russia)?
(Disclosure: Speaking as a payer of Canadian taxes with an economic interest in Canadian temperatures, i.e., preferring it stay cold enough for good skiing in B.C.)
Eli, why do you say the two stations you have posted photos of have a cooling bias?
It looks to me like the NOAA has already adjusted for the cooling bias by installing asphalt near the sensors.
Everything looks good to me. ;)
Paul S
Paul,
You realize, of course, that there are very few truly road-less areas in the lower 48, right?
The thing I love about this debate is that some people are so reasonable -- and logical.
From an earlier post, we learned that heat rises and draws in cooler air from the surroundings (if we did not already know that)
On this one, we learned that trees and grass have a cooling effect due to transpiration (a big word for evaporation) -- if we did not already know that.
BTW, what does S stand for, Paul S? Based on your comments and those of John S., I think I know.
Paul
How far away do you think that road in the picture is?
If the KBS foundation (an apt acronym if ever there was one) had put in measurements perhaps we would all know.
Then again, that might confuse things since we would have the old "metric vs english" issue to deal with (the one that caused the burnup of the mars lander)
On second thought, far better that there are no measurements.
"THE HIGH TEMPERATURE AT SKY HARBOR
IN PHOENIX REACHED A RECORD-BREAKING 113 DEGREES TODAY. THIS NOT ONLY
TIED THE RECORD HIGH FOR THE 29TH OF AUGUST BUT ALSO SET A NEW RECORD
29 DAYS OF 110 DEGREES OR HIGHER IN PHOENIX IN A CALENDAR YEAR."
Don't worry.
Phoenix burned up multiple times in the past and always came back to life
There is no reason to believe that this will be any exception.
== anony said: ==
=="Paul,
You realize, of course, that there are very few truly road-less areas in the lower 48, right?"==
LOL. Guess it's impossible to place site sensors 100 feet away from roads. Hope the climatologists don't fall back on that excuse.
Regards,
Anon 5:14:
How far away is that road? It's not clear from the picture since the perspective foreshortens the view.
That's not much to ask for -- an actual measurement.
The next step after measuring the distance to the road will be to take more measurements -- in order to determine how much of an effect a road x feet away from the sensor has on the measured temperature.
This is supposed to be science, after all. Real scientists take measurements.
Doesn't matter to me how far away the road is.
The experts who authorized the placement of the sensor are the ones responsible for ensuring their sites are WMO compliant, not me.
Until the experts explain why their sites routinely violate WMO standards, people are obligated to question the integrity of the expert's data.
"Real scientists take measurements".
But apparently, climatologists don't.
Regards,
Paul S
John Mashey asks: "Anyway, why aren't people agitating to see more GISS-like graphs for Canada (and Russia)?"
Do Canada and Russia have a scientist who is the equivalent of James Hansen?
Hansen seems to be what brings many of these nuts out of the woodwork. He keeps the denialist crowd stoked (albeit unintentionally). Without him, they would simply shrivel up and die.
They just hate him.
They hate that he was right with his 1988 temperature projection. They hate that he has published so many peer-reviewed scientific papers.
They hate that he garners so much respect within the scientific community.
They hate that he expresses his opinion on policy matters that he considers important.
And most of all, they hate that he has significant influence on said policy matters.
paul,
How can you say in one breath that it "Doesn't matter to me how far away the road is" and in the next say that "their sites routinely violate WMO standards"?
How do you know they are violating the standards if you do not even know how far away the blacktop surface is from the sensor and whether the distance indeed is less than the specified minimum?
Anony, we already know numerous sites violate WMO standards.
Absent a credible explanation, the responsibility of the general public is to question the validity of the data from the contaminated sites.
Let a climatologist get a bloody tape measure and figure out how far the asphalt is from the sensor.
Regards,
Paul S
This picayune questioning of the stations is silly, IMHO. They are not perfect - is that a surprise? The bottom line is that scientists ask the question: What is the trend in temperature now and in the past? How do they get the data? Existing stations and records from these stations. The challenge is how to extract useful data from these records (and tree rings, and sediments, etc.) that are imperfect. The fact that their conclusions are supported by independent measurements from satellites speaks to the utility of the data. Somehow this point is lost by the CA crowd. Maybe I can make them work in the biological realm.
"John Mashey asks: "Anyway, why aren't people agitating to see more GISS-like graphs for Canada (and Russia)?"
Do Canada and Russia have a scientist who is the equivalent of James Hansen?
Hansen seems to be what brings many of these nuts out of the woodwork. He keeps the denialist crowd stoked (albeit unintentionally). Without him, they would simply shrivel up and die.
They just hate him.
They hate that he was right with his 1988 temperature projection. They hate that he has published so many peer-reviewed scientific papers.
They hate that he garners so much respect within the scientific community.
They hate that he expresses his opinion on policy matters that he considers important.
And most of all, they hate that he has significant influence on said policy matters."
You missed one: they hate that he won't make all of his data available.
...and they hate that he corrects the tiny errors that they find and then shows how little they mean to the overall picture.
..and that they aren't awarded a Nobel prize for finding Hansen's tiny errors.
..and that, despite all their years of efforts, they still can't find a significant error in Hansen's work
...and they hate that NASA had to fire their spokesperson George Deutsch after Hansen went to the NY Times and complained of censorship.
...and they hate that NASA Chief Griffin had to back off from his statement about global warming after Hansen chided him.
... and that one of Real Climate's primary contributors is Hansen's NASA colleague Gavin Schmidt (oh, how they hate that)
... and that Hansen gets prizes for his scientific work and they don't.
...and they really, really, really hate* that Hansen said that Al Gore's movie "Inconvenient Truth" told a story that is "scientifically accurate".
*hate is probably not a good enough word in the case of Gore's movie. "Despise" or "loathe" would probably be better. Yes, they "despise", "loath" (and hate) "Fat, hypocritical" Al Gore and the fact that Hansen gave him a thumbs up on his movie.
... and they hate that Hansen will not "joust with jesters", "aggregate with asses", "banter with buffoons", "clash with with clowns", "dapple with dim-wits", "heckle with hacks", "lounge with lemmings", "mingle with morons", "niggle with nitwits" or "opine with opossums".
First, I have to laugh because the random word I had to enter as part of the word verification was therml.
I see the criticism on here that GISS temperature graphs are not included for all stations on Anthony's site. Because doing so was not part of Anthony's original set of instructions it was done inconsistently - some surveyors did and some did not. I don't believe there was any ulterior motive involved.
Anthony recently sent me a note asking if I could help him add the GISS graphs for all surveyed stations, and I said I would. It may take a couple of weeks to get it done, but it will get done.
So, good suggestion.
Anon 6:17, just measuring the distance to the asphalt is useless. You have to understand how any effect of the asphalt varies with the distance, you have to ask if there is a difference with different wind directions and even more. And, of course you need to know when the station and the asphalt were put in and what was there beforehand.
This is the weakness of Surface Stations. It has no real post- or pre-dictive value esp with respect to trends.
In Canada, much of the rightwing hatred is focussed on David Suzuki. He trained as a geneticist, and for many years has hosted The Nature of Things, a TV show about all sorts of science and nature topics. He promotes environmentalism. So he is a public figure and an obvious target for rightwing dimwits who hate all environmentalists.
http://www.cbc.ca/natureofthings/
http://www.davidsuzuki.org/
Yes, that makes sense. Evolution is another science hated by right wing (mostly religious) groups.
It seems that any science that says that humans are part of nature is a target for attack.
At one time (in Galileo's time), physics was also included in that group.
== eli says: ==
"Anon 6:17, just measuring the distance to the asphalt is useless. You have to understand how any effect of the asphalt varies with the distance, you have to ask if there is a difference with different wind directions and even more. And, of course you need to know when the station and the asphalt were put in and what was there beforehand.
This is the weakness of Surface Stations. It has no real post- or pre-dictive value esp with respect to trends."
Another case of blaming citizens for the failure of climate professionals to adhere to their own standards.
If the NOAA can not inform us when the aspalt was installed or demonstrate how this particular contaminant has been corrected, the public must reject data from sites such as these.
The appeal to authority so commonly seen on the issue of AGW is infantile submission when the "authorities" gather data in an unscientific and unprofessional manner.
Regards,
Paul S
And the appeal to non-authorities is infantile as well when their efforts lack the very quality control that they are criticizing the authorities for ignoring.
Watts' efforts would have been much more effective (and better received) if he had at least attempted to approach this whole endeavor with some modicum of professionalism.
In other words, if he had kept the speculations/comments, etc about AC's, trash barrels, grills and the like to himself and merely presented the program on his website as what he claims it to be: a photo- (and other data) gathering project.
For every good way of approaching a project, there are always many bad ways.
He is largely to blame for the criticism he has received. he may not care, but it does make a difference when you are trying to convince people that you have something valuable to contribute that they are not immediately suspect of your motives.
But, alas, that is all water under the bridge. The opportunity to do it right was missed.
Paul... there is no evidence that the road contaminates the signal. If the NOAA are to evaluate every possible micro-climate impact in every site in the method described, you, the public, are going to have to provide the extra funding to evaluate disconuities and biases which are already substantially corrected for. Such post-collection adjustments as GISS provide are standard course in empirical-based physics research; it is very rare to have a sufficiently clean signal to begin with in any branch of data-gathering -- most of the time that is physically constrained by the measuring apparatus and environment. Donald Rumsfeld once said, we go to war with the army we have, not the one that we wish we had. We construct the temperature record from the stations and the historical data that we have. Are you going to build a time machine? Are you going to throw out the record based on what? -- you still have no evidence. The land temperature record is confirmed through satellite, sea surface temperature, borehole temperature and proxy measurements. Individual station records are confirmed by neighbouring stations, or adjusted, or thrown out by GISS. Those that creep through are submerged by oversampling. Your case therefore that the public "must" reject the data is non-existent. First show some evidence, real evidence. It is not up to the NOAA or GISS to prove a negative.
lazar, it is up to the NOAA and GISS to follow their own professionals standards. When they fail to do so, the public is not required to accept their data at face value.
If the NOAA or GISS require more money to properly audit the historical record, let's give it to them.
Regards,
Paul S
I'm glad that you support more funding for climate research.
NOAA publish guidelines which they and doubtless NASA GISS would like to see implemented. If those guidelines are to be ignored, then they face a choice -- throw out the data ipso facto, or to continue to analyze the data for disconuities/biases. I do not view the latter as being "unprofessional". Scientists mostly do the best they can constrained by imperfect data and resources. There is a need to estimate, even a need to guess -- this is balanced by a need for accuracy.
Now the public is not required to accept nor reject the temperature record due to either approach.
For the reasons listed previously, logic and the available evidence suggest to me a high confidence in the temp record is not misplaced. Until there is actual evidence that the record may be substantially inaccurate, I'm quite happy to have full confidence in the NOAA, GISS, HadCruT etc.
the public is not required to accept their data at face value."
Nor is anyone required to accept your silly photos at face value, which is to say no is required to accept them period -- because that's all the photos have is "face value".
== anony said: ==
="Nor is anyone required to accept your silly photos at face value, which is to say no is required to accept them period --"=
Correct. The photos however, could undermine the credibility of the long term surface temperature record for the USA.
Unless climatologists offer a plausible and sensible explanation that they have properly accounted for these potential biases (and I have heard no such explanation yet)
the photos may well erode the public's confidence in some of the climate experts proclamations.
Regards,
Paul S
The photos however, could undermine the credibility of the long term surface temperature record for the USA.'
Dream on.
If whose mind? Your own? You have already made that decision.
So has Tony Watts (if you are not he) .
He made it before he posted the Marysville/Orland combo with the graphs and implied warming in one, cooling in the other.
But if you believe "In the public mind", you are simply mistaken.
No matter what fanciful story you tell based on a few photos, most members of the public are not going to look at that photo of farmington and see warming (or even a road). They are going to see a cool grassy spot in the woods of Maine.
So, by all means, keep wasting your time taking the silly photos. it means about as much as the rest of the stuff Climate Audit gets involved in -- nothing.
Don't say no one warned you.
== anony said: ==
="But if you believe "In the public mind", you are simply mistaken."=
It is the public, and the public only, that will ultimately determine if and what action is taken against AGW. I would not so quickly dimiss the "public mind".
="No matter what fanciful story you tell based on a few photos, most members of the public are not going to look at that photo of farmington and see warming (or even a road). They are going to see a cool grassy spot in the woods of Maine."=
Warming, cooling, does it really matter? The site is non-WMO compliant. As such, we can consider the quality of its temperature measurements to be suspect.
Regards,
Paul S
Tamino had an excellent post on how averaging both cooling and warming biases at individual stations averages out leaving an accurate trend
This debate will never be settled because at least some of the people who believe that the temperature record is "contaminated" would scrap the whole thing.
They say (or at least imply) that you can't estimate the effects of things like blacktop and nearby AC's, so what that means is that they will insist on throwing out any data that even might be so affected.
In fact, "might be" is a very subjective term, so someone can (and undoubtedly will) interpret that to mean that they can throw out all the data if they so choose.
Say, for example, that NASA goes along with such a scheme (which is far from certain at this point, to say the least) and throws out half the data.
Do you think everyone is going to be happy?
Of course not.
Some are undoubtedly going to ask "Why did you throw out that data and not this data?" -- ie, they are not going to trust that NASA is not cherry picking.
So, it's a no win situation for NASA. If they don't throw out the data, they are accused of keeping data that biases the record toward warming.
On the other hand, if the do throw out the data they will also undoubtedly be accused of biasing the record toward warming.
This topic of what to do with the photos is not one that has even been discussed as far as I can see -- and it is undoubtedly going to be the killer.
The problem with doing things from the outside like Watts is doing is that it makes it that much less likely that people on the "inside" (NASA in this case) will accept -- and actually use -- any of the information that he comes up with.
he might have very valid data, but if no one looks at it, it makes no difference.
Personally, i think he has done a very poor PR job of this from the start. He has set it up as a confrontational issue which virtually assures that NASA will not cooperate no matter what he finds.
I am not saying that is good, just saying that that is the reality as i see it at this point.
waste of time.
Post a Comment