The anonymice gave Eli a new Spectral Calculator toy for the Fourth of July, and he wants to use this to talk about CO2 absorption and emission in the atmosphere and how it is affected by pressure, temperature and composition. Today temperature. Tomorrow pressure. and the day after composition. These are prequels to Ray Pierrehumbert and Spencer Weart's Real Climate posts on CO2 concentrations and greenhouse warming. The Spectral Calculator allows a simpler graphical presentation (Eli hopes).
Start by going to the Spectral Calculator
- Click on the observer tab
- Set the Lower Limit to 620 cm-1
- Set the Upper Limit to 720 cm-1
- Click on calculate. You have now set the spectrum window to match the CO2 low frequency bending mode spectrum, the mode that is responsible for CO2's greenhouse activity. Don't worry about what appears. Is is the absorption spectrum of water vapor in this window.
- Click on the Gas Cells tab
- Select CO2 from the Gas drop down menu
- Set the Isotopologue to 1 O(16)C(12)O(16). All but a few percent of the CO2 in the atmosphere is in this form, but we are doing this to simplify what follows. You can fool around later by selecting All isotopologues, or one of the rarer ones.
- Set the VMR (volume mixing ratio) to 0.000380. This matches the current 380 ppm CO2 atmospheric concentration.
- Set the Pressure to 100 mbar. We want to isolate the effect of changing temperature and keep the total pressure relatively low. Remember that the CO2 pressure is the product of the VMR and the Total Pressure
- Set the Length to 200 cm. This was chosen so the software serves graphs covering the full scale.
- Set the temperature to 200 K (we will change this later) 200 K is about as cold as it gets in the troposphere, during Antarctic winter.
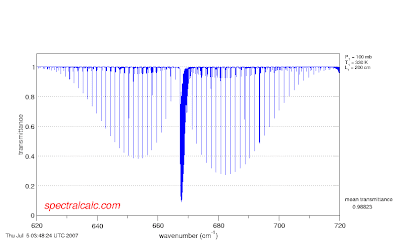
- Click on calculate. You should see the following spectrum:

You should click on this to see a larger, clearer picture
The hump on the right is called the R branch and corresponds to a transition where the rotational quantum number in the excited vibrational level is one greater than that in the ground state. The hump on the left is called the P branch for which the rotational quantum number is one less in the excited vibrational level, and the sharp peak in the middle is the Q branch, where the rotational quantum numbers are the same in the upper and lower vibrational levels. This transition is from the ground state, with vibrational quantum number v"=0 to the first vibrational state, with vibrational quantum number v'=1. Call this a (1,0) transition.
The rotational levels in the R and P branch closest to the center Q branch originate in states with the lowest rotational numbers, those furthest away, to the far right-R branch, or the far left-P branch start from the highest rotational quantum numbers. You can count the lines in theP branch starting from the Q branch head, and the number of the line is the same as the rotational quantum number. The first R branch line is hidden under the Q branch
If you look carefully between the lines in the P and R branches you see a little bit of "noise". These are really absorptions from v"=1 to v'=2. This would be the (2,1) band. We can see this if we raise the temperature to 330K (as hot or a bit hotter than it gets on Earth)
 The rotational lines of the (1,0) transition for larger values of rotational quantum number (those to the far right in the R branch and the far left in the P branch) are bigger because as the temperature increases, the concentration in the higher rotational levels increases as (2J+1) exp(-B"J(J+1)/kT). J is the rotational quantum number in the ground state, B" is a molecular constant, k Boltzmann's constant and T the temperature. The intensity of the absorption depends on how many molecules are in each rotational level of the ground vibrational state. Count carefully the lines in the P branch. The maximum absorption (minimum transmission) at 200K is J=7, while for 330K it is at J=10. Second we see that the intensity of the (2,1) band increases.
You can play with increasing the temperature even further. Also go back to the observer page and narrow the bandwidth (to perhaps 620 - 680 cm-1) to see lines in the (2,1) band more clearly. Set the temperature very low, say 100K and see that many fewer lines appear and how they are as a group closer to the center.
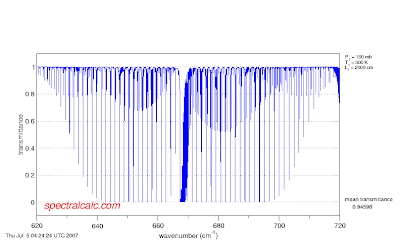
Higher temperatures increase the population of higher energy/quantum number rotational levels. These levels absorb IR light further away from the center of the band. If you increase the path length from 200 cm, to 2000 cm the lines in the center of the band are saturated, but those on the outside are not.
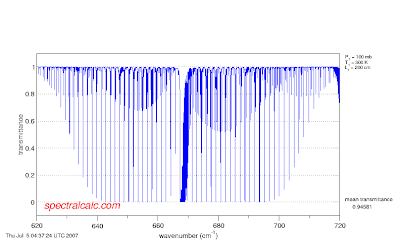
 If you keep the path length constant at 200 cm but increase the mixing ratio by an order of magnitude, the same thing happens.
In this way, even though increasing the CO2 concentration will not increase the absorption of light at the center of the band, it will at the wings.
UPDATE: If you want to learn about pressure broadening see here and here and finally here
Eli,
ReplyDeleteThat is gorgeous stuff. It illustrates quite well why carbon dioxide is never saturated - particularly the last image. I had no idea it looked like that, either. Incidently, I had run across the SpectraCalc before - inadvertently, a few weeks back. I suppose I should have mentioned it, but I thought everyone would have already known.
I might do some poking around - I would prefer something that would give me a little more flexibility. For example, I might like a zoom. But as is, it looks quite useful. And that last CO2 curve is downright elegant.
OK. I let you walk me through, then played with it a little - and didn't even realize that it was keeping track of all the previous plots! I was able to adjust the left and the right and zoom in on the Q-branch just as I wanted to when I first saw your plots. And that is without a subscription! I will be playing around with it more in the days to come.
ReplyDeleteThanx again!
Glad you're enjoying the spectracalc tools Eli!
ReplyDeleteVery educational post. I'm looking forward to the next ones.
SCM
(aka Some Cool Mouse)
The spectral calculator did not work at all for me. But never mind, Eli told a nice story about why CO2 does not get saturated.
ReplyDeleteNow, can you do another story that shows why CO2 in the upper atmosphere is relatively more important for the greenhouse effect, as the radiation balance model suggests?
Was it raining so hard yesterday that the fire for grilling the carrots was drowned? Eli needs to have some r&r and not play so much with models. But we are grateful the insights into "saturation".
ReplyDeleteIt was dry where the Danomouse fambly was (different than the bunny fambly was, but some of the mountains the bunny can see are seen from here), but you could hear the thunder.
ReplyDeleteBest,
D
Saturation smaturation,
ReplyDeleteWe could use a little maturation,
From Harvard profs, we've had enough,
Of this and other crackpot stuff.
They make the claim that "CO2,
Is saturated through and through,
It's had its cake, give it a break,
It's wolfed down all that it can take."
"It cannot eat another bite,
Not in the day nor dead of night.
So space-bound photons move right through,
The atmosphere as they will do."
But back on earth, the quiet Rabett,
Calculates, as is his habit,
No saturation does he see,
Instead of one line, he finds three, then six and nine and 43.
When he saturates the central line,
Those in the wings are killing time.
After increasing the amount of CO2,
The photons don't just fly on through.
Instead, they're stopped like all the rest,
But Rabett's graphs explain it best.
The result is warming of the air,
But some don't really seem to care.
That's some good stuff, anon.
ReplyDeleteBest,
D
Could you explain very simply what this means? Is the argument that the previous assertions that successive doublings or increases in CO2 have diminishing effects on roughly logarithmic lines false?
ReplyDeleteOr, if this is just a confirmation of diminishing returns, what exactly is its significance?
It is a very nice tool, so thank you for that, but I am having trouble seeing what its relevance is to the present debate about warming.
Thanks in advance.
Is it possible to set it up to show absorbance rather than transmittance?
ReplyDeleteIn principle, if you subscribe you get the ascii data, which is simple enough to set up as absorbance. Otherwise, I would say drop them a note. The data is certainly there.
ReplyDelete