Missing the Trees for the Forest

The statistical treatment, Rabett Run will leave to our betters, except noting the assumption that fluctuations at the sites are normal. Still that should not make an enormous difference.
More concerning is the overwhelming naivety of their attribution studies. While it is true that public discussion focuses on the global temperature anomaly, this is, at best, a crude and not very informative axe that BEST is wielding, a tool that you can pick up in any blog (see Wood for Trees for the franchised version). It ignores the spatial structure of the forcings and the observations which are necessary for real attribution. Although it notes some, thus missing the trees (what kind are they, how old, condition), for the forest (look, great Birnam wood to high Dunsinane hill shall come). OK, it did not make much difference to MacBeth in the end that the trees were fir, dead is dead, but in trying to understand the past, present and future of the earth linking cause and effect requires more than a single global parameter.
In particular the proud abhorrence of using models, to validate observations and explain correlations, the forest level comparisons, ignoring anything at a finer level than global land surface temperature anomalies, drives a huge stake through the paper, whose conclusions, while probably along the right path,
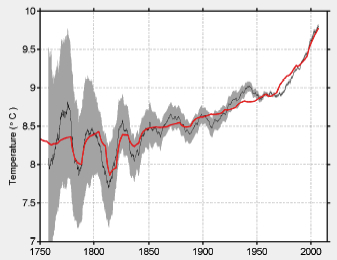
Many of the changes in land-surface temperature follow a simple linear combination of volcanic forcing (based on estimates of stratospheric sulfate injection) and annanthropogenic term represented here by the logarithm of the CO2 concentration. The best fit an volcanic forcing term is -1.5 ± 0.5 ºC per 100 Tg of atmospheric sulfate. The anthropogenic forcing parameter is 3.1 ± 0.3 ºC for CO2 doubling (compared to pre-industrial levels), broadly consistent with the IPCC estimate of ~3 ºC for the equilibrium warming at doubled CO2. When we included solar forcing we found that the solar variability record assumed by the IPCC did not contribute significantly to the fit of historic temperature. This could imply that any effect associated with solar variability is too small to be detected by our simple approach. It might also imply that the shape of solar forcing assumed by the IPCC during the last 250 years is too inaccurate for an effective comparison. However, if the shape of the solar forcing history is accurate, then the impact of solar variability on climate would have to be on the low side of present estimates, no more than 0.08 ºC since 1750.are not really supported by the low level curve matching without spatial (including up) pattern matching and modeling studies. This is true not only of the global temperature anomaly, but also the correlations against the AMO and more. In Michael Mann's twitter: Welcome to 1980 Rich.
Watts' opus has been dispatched by Victor Venema, as linked from the Weasel who also doesn't much like Rohde, Muller, et al.


15 comments:
"The figure at the left"
Somebunnies might think that Eli has made a mistake here, but they must remember: Eli is INSIDE your computer screen.
Problems with naïvety of attribution methodology? Nah...
This is how Tim Curtin does all of his work, so it must be fine.
Bernard J. Hyphen-Anonymous XVII, Esq.
Yes, very 1980-crude, but perhaps we really have reached the point where such an analysis can reach the right conclusion, although if so that would just make it a novelty rather than a substantive contribution to the literature.
Thanks for raising Muller's previous fantastic voyage, John. I vaguely recall that after those years of attempted curve-fitting on their part (and I guess Robert, who seemed to take forever getting his PhD, must have done his dissertation on this?) someone else beat them to the punch by finding a correlation between periods of high speciation and the Earth periodically poking its head up above the galactic plane long enough to get a big extra dose of cosmic rays.
> the Weasel who also doesn't much like Rohde, Muller, et al.
Well, I've been slagging off Muller, not anyone else. Rohde is currently only guilty of saying silent and failing to correct Muller. And quite possibly Muller is making sure he does.
"I don't like to BEST, but..."
-- by Horatio Algeranon
We've just made
A Nobel find
The sky is blue
With black behind
The grass is green
The sun is hot --
And so is fire
(But ice is not.)
And global warming's
Really real
Our BEST has really
Clinched the deal.
Logarithm of CO2? What, the other GHGs and anthropogenic aerosols are all invisible?
-MMM
Horatio added a stanza to the above
Our climate data
Is simply the BEST
More roboast
Than all the rest.
Well (cough, cough) as a physicist I have to confess I posted a very similar curve-fitting on arXiv as part of a response to Monckton years ago. Won't link as I realized afterwards some of the problems.
But the interesting thing here to me is that with BEST going pre-1850 there are first of all some very large volcanic contributions (though how reliable are those sulfate estimates) that seem (with large error bars) to have very large manifestations in the temperature curve. Second, you are perhaps getting a better picture of the low point in the "hockey stick" curve with that 1750-1850 portion, dubious though it may be, and it is quite uniformly and smoothly low which constrains a lot of simplistic "natural oscillation" models that have been fit only to the post-1850 data (Roy Spencer's funny cloud oscillations come to mind).
And thirdly, I assume because this is a land-only temperature, we're seeing a rather more significant and earlier response to the CO2 rise. The 3 degree sensitivity they find is about 50% larger than the 2 degree-typical transient sensitivity you find for global temperatures with this sort of fit, but the 1.5 C rise from 1800 is similarly larger than other records show.
So - in brief - I think by adding pre-1850 data this is actually providing some useful information on the role of human-emitted CO2 from well before 1950 - even though it did not dominate short-term temperature changes over that period, it could certainly be credited with a discernible influence on the gradual long-term rise.
So, I'd rate the attribution piece as moderately useful based solely on the longer temperature record, in my view.
Looking at the backgrounds of the other BEST authors, it appears they would have little problem doing a complex attribution study. They opted for simple.
So why can't it be simple? In physics is simple never allowed? Is looks like a duck, quacks like a duck, floats like a duck, flies like a duck, and poops like a duck never allowed to establish it's a duck?
"Looking at the backgrounds of the other BEST authors, it appears they would have little problem doing a complex attribution study. They opted for simple."
Mosher and Hausfather both say that there was a lot of disagreement over the decision to take this approach, so at least it seems they were aware of the controversy it might cause.
My impression is that the attribution stuff isn't really targetted at scientists ...
Because simple does not have very much discriminatory power between choices. It is a weak indicator which points to the need of more sophisticated methods. Just look at all the wiggle fitting you can find at watts or curry's
Eli - I understand that, but these guys are not curve fitters by history or nature. They appear to be stout physicists. The hint they are giving is complexity gave an answer that is no better in terms of correctness, and was perhaps less eloquent. These other authors don't get shy in the face of complexity, so I guess if the world demands it, they'll get on their complexity faces and write 50,000 pages on why 1+1=2.
I liked the AMO and ENSO stuff. It's exactly what I've been thinking.
Not curve fitters?
Nemesis.
John Mashey - I was talking about the other authors; the ones who haven't knocked down grandmothers to get to get in front of a camera and a microphone.
JCH: oops, sorry, I missed the earlier post about other authors.
However, I am not convinced that as a group they would have no trouble doing a complex attribution study, even though I certainly respect some highly for their work (such as Art R). It is not enough to be even a brilliant physicist, one has to know the field, and ideally have written credible peer reviewed papers in it.
Attribution work is *hard*. Very good climate scientists argue about it endlessly.
Anyway, I haven't looked very hard, so I don't know, but do you know of credible attribution papers by the editors?
Post a Comment