More tornadoes

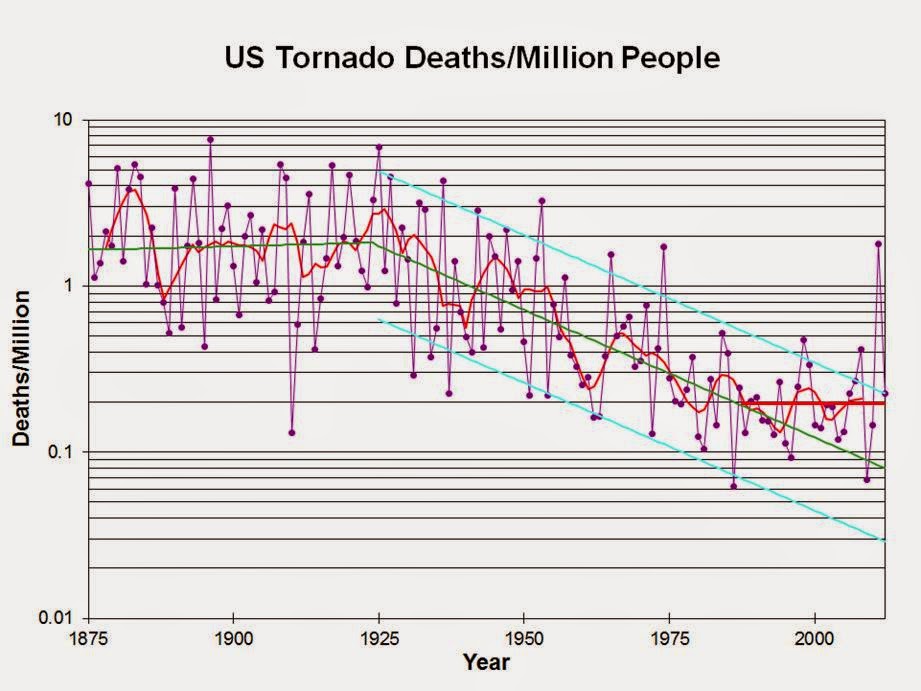
In an earlier post discussing tornadoes, Eli showed a figure from Harold Brooks
Elsner's result depends very strongly on reported path width-the intensity is a strong function of width and then he multiplies the implied v^2/2 by the area of the tornado (width*length). Path width is the worst part of the dataset. Reported value changed from mean to max width in '94. More detailed surveying will lead to increased max width. With adoption of EF scale in '07, there's an abrupt doubling of the reported widths for reasons that aren't clear. No trend in width from '94-'06, nor in '07-'12. Just a step function at '07.Eli thought this was not as open and shut as Harold thought
One of the big things about the first graph is that it's an updated version from one that was first made in 2000. At that time, it was still a question as to whether the decline had stopped (were '98 and '99 just a couple of big years and the next few would drop well below the regression line?). My co-author and I predicted that it would be clear that the decline had stopped with a few years after 2000. Our very simple model of that was based on the much greater risk of death (15-20X) for mobile home residents compared to permanent home residents and the increase in the fraction of housing units that are mobile homes. Just using that led to a flat line in the overall deaths/million that we predicted would be apparent shortly after our publication in 2002. Brooks and Doswell 2002
If what we are seeing is the mobile home effect, then the great recession in 2008 which threw a lot of people out of their homes should have produced a notable uptic in deaths of those in trailers. Has it?The Rabett wondered if Harold's SWAG was the answer so he went to the American Housing Survey and tried to pull out the data, in this case the number of mobile homes per million people in the US

Something else? Something that is level to ~ 1920 changes fairly quickly afterwards and then levels off ~1980. Hmmm. MT will love this. Eli not so much

If you want to read more about Piketty start here or here, but it certainly suggests that raw GDP is maybe not the right thing to use. It would be macabre, but informative to plot the average income of people who die in tornadoes. Safe rooms cost $$


3 comments:
This thread seems lonely.
So, the next week appears to hold another tornado outbreak, this time in the Great Plains ( tornado alley ):
http://www.spc.noaa.gov/products/outlook/
The first storm which will invoke these tornadoes is just now apparent off the California coast:
http://www.spc.noaa.gov/products/outlook/
As this storm ( and one which will follow ) sweep in, they will bring their high winds aloft, which will give very windy conditions to the SW and when thunderstorms lift this vertical rotor, horizontal tornado rotors will form.
Drive by complete.
Ooops.
Sever storm outlook
Pacific Storm Approaching
You've misinterpreted what I said. The question was not whether mobile home deaths were playing a larger role in tornado deaths in the late 90s. That was obvious (an increase from 25% of total deaths to 50% of total deaths in ~20 years. The question was whether the levelling off in death rate that had some hints by the late 90s would be obvious by, say, ~2005.
The plot that you show here indicates that the AHS data says there wasn't an increase in mobile homes after the recession, so that question about whether mobile deaths since '08 had increased (which would be a very short record in any event) wasn't all that relevant.
As you can read in the 2002 paper, we used census data for housing from 1950-1990, when the US fraction of mobile homes went from <1% to >7% and, in the southeast, reached >13%. The "other surveys" linked show an increase in MHs between 1985 and 2001 of ~60% with a population increase of <20%. That seems like a larger increase than the AHS plot you have shows.
Post a Comment