Which Came First or Beyond Correlation
An evergreen (you know CO2 makes for more plant growth) of the denial industry is that "you can't show that CO2 CAUSES Climate change". Let Eli fish a few of these poggies out of his Twitter bag
You understand no correlation is definitive. That is why you are reverting to word salads with references to things which are not facts.
The bottom line is there is no correlation between temperature and CO2. That falsifies the AGW theory.
See below. pic.twitter.com/lMDuXRN1kq— BubbasPossumRanch (@BubbasRanch) June 13, 2023
and another
The idea that earth’s climate, which is immensely complicated, can be dialed hotter simply by increasing CO2, and lower by decreasing, is very poor science.
— John Johnson (@JohnK1234abcd) June 19, 2023
This chart of geological time clearly shows that CO2 has no meaningful correlation with Earth’s temperature. pic.twitter.com/UQUMGIrWrX
But it, of course not, is not just the CO2 has no effect on climate, but the anti-vaxxers and any other delusions of the denial crowd declaring that correlation is not causation. Well, as Eli has been rumored to reply, it can be a pretty strong hint if you understand the mechanism. To be honest, Eli is not very comfortable with any claim that correlation is causation lacking a mechanism, it's the physicist in the Bunny but there is a reason physicists are rare.
We use a newly developed technique that is based on the information flow concept to investigate the causal structure between the global radiative forcing and the annual global mean surface temperature anomalies (GMTA) since 1850. Our study unambiguously shows one-way causality between the total Greenhouse Gases and GMTA. Specifically, it is confirmed that the former, especially CO2, are the main causal drivers of the recent warming. A significant but smaller information flow comes from aerosol direct and indirect forcing and on short time periods, volcanic forcings. In contrast the causality contribution from natural forcings (solar irradiance and volcanic forcing) to the long term trend is not significant. The spatial explicit analysis reveals that the anthropogenic forcing fingerprint is significantly regionally varying in both hemispheres. On paleoclimate time scales, however, the cause-effect direction is reversed: temperature changes cause subsequent CO2/CH4 changes.
This is not unexpected, indeed a figure that your friendly correspondent has used frequently to describe cause and effect, drives home this conclusion on physical grounds (Figure 1.1 Feedbacks in the climate system by Kurt Lambeck)

The information flow method was developed by X. San Liang in 2014 [SADLY NOT OPEN] for exactly this kind of situation (there is another method for separating cause and effect called Grainger causality)
Given two time series, can one faithfully tell, in a rigorous and quantitative way, the cause and effect between them? Based on a recently rigorized physical notion, namely, information flow, we solve an inverse problem and give this important and challenging question, which is of interest in a wide variety of disciplines, a positive answer. Here causality is measured by the time rate of information flowing from one series to the other. The resulting formula is tight in form, involving only commonly used statistics, namely, sample covariances; an immediate corollary is that causation implies correlation, but correlation does not imply causation.
More in this paper by Liang [OPEN] for those wanting to dive in but let's look at what Stips, et al, find for information flow to global temperature anomaly between 1900 and 2008.
|
Radiative Forcing |
Correlation and
Causality–HADCRUT4 |
||
|
Correlation |
Forcing→GMTA
[nat/year] |
GMTA→Forcing
[nat/year] |
|
|
Total forcing |
0.804 ± 0 |
0.244 ± 0.091 |
0.036 ± 0.080 |
|
Anthropogenic |
0.863 ± 0 |
0.355 ± 0.112 |
−0.008 ± 0.005 |
|
All GHG |
0.852 ± 0 |
0.318 ± 0.108 |
−0.005 ± 0.003 |
|
CO2 |
0.852 ± 0 |
0.316 ± 0.108 |
−0.003 ± 0.003 |
|
Aerosol |
−0.810 ± 0 |
0.232 ± 0.095 |
−0.002 ± 0.006 |
|
Cloud |
−0.796 ± 0 |
0.208 ± 0.092 |
−0.001 ± 0.004 |
|
Solar |
0.616 ± 0 |
0.082 ± 0.059 |
0.035 ± 0.051 |
|
Volcanic |
0.089 ± 0.267 |
0.003 ± 0.006 |
−0.004 ± 0.009 |
|
AMO (1900–2008) |
0.477 ± 0 |
0.018 ± 0.043 |
0.021 ± 0.014 |
|
PDO (1900–2008) |
0.123 ± 0.204 |
−0.002 ± 0.013 |
−0.011 ± 0.025 |
This is a good real world example that illustrates the basic fact: correlation does not mean causation. It further questions the assumed fundamental role of the AMO for the global climate as speculated in38.
That should make Mike Mann very happy if he has not seen it.
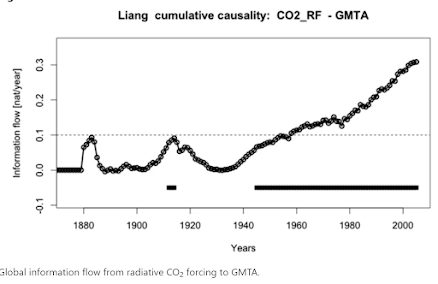
Also interesting is the cumulative causality
But what about paleoclimate?
By calculating the IF in nat per unit time from the 1000 year interpolated PAT time series to CO2 concentration we get 0.123 ± 0.060 nat/ut and −0.054 ± 0.040 nat/ut in the reverse direction. Therefore we have on these long time scales a significant IF only from the temperature data to the CO2, but not in the other direction, exactly opposite to that seen in the data from the last 156 years. This result proves robust against using different ice age/gas age chronologies (SI, Tables SI-5 and SI-6 comparing EDC3 and AICC2012 chronology) and against using the recent corrected CO2 data from Bereiter45 (SI, Table SI-7).
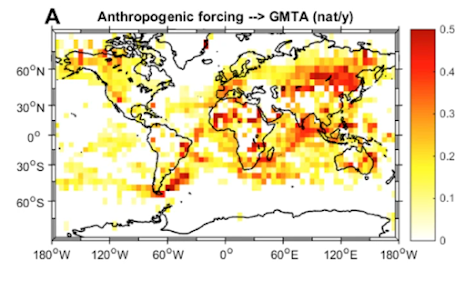
which is just what Figure 1.1 shows. And what about the future, where will increasing GHG concentrations bite the hardest. Stips, Macias and Coughlan have an idea based on information flow


 Posts
Posts


