Friday, August 31, 2007

Birthing a mouse is hard


Eli posted the new American Association of Petroleum Geologists climate change policy with the remark that it was a mouse, but a mouse is better than a rat. Some disagreed, claiming that rats are cuter and smarter. As a keeper of whip smart anonymice, Eli disagrees, but de gustibus non est disputandem (Eli won't bother arguing with your bad taste). It is interesting to read the AAPG President's column which opened season on the previous policy.

During my tenure as president I have received correspondence from members on various topics -- but the two largest volume topics have been the proposed “graduated dues” structure and AAPG’s current position on global climate change.

Members have threatened to not renew their memberships if the graduated dues system is passed, or if AAPG does not alter its position on global climate change (although not the same members). And I have been told of members who already have resigned in previous years because of our current global climate change position. 

My response is: You have a much better chance of changing AAPG from within than from without. It sounds like the old saying, “Don’t throw the baby out with the bath water.”
and continued
This year’s Executive Committee has listened to members’ views on global climate change, and we have appointed an “all-star,” balanced committee to recommend a set of facts on global climate change (see box above). 
As stated in my January President’s Column, this committee’s work should result in a set of facts on climate change that will replace the current position paper and that can be distributed at member’s request in the form of a pocket-sized card. This change is occurring because we are listening to AAPG members, not because we are listening to members of other organizations. 

Appointing the ad hoc global climate change committee was one of my most important tasks this year as president. I relied upon the wisdom of the Executive Committee, but also DEG President Jane McColloch and DPA President Rich Green. Every member I asked to serve on the committee agreed because it is such an important issue to him or her, and they want AAPG to “get it right.” 
Why is AAPG’s position on climate change so important?
  • Members need facts to communicate with their own communities, newspapers and government officials as debate on climate change policies intensify both in the United States and globally. Global policy makers need our geologic input to make scientifically sound decisions.
  • The current policy statement is not supported by a significant number of our members and prospective members.
AAPG is indebted to this dedicated committee, and we are anxious to see their recommendation 
Being president of AAPG is challenging and consuming, but the attitude and help from volunteer members make it all worthwhile.
Comments on the proposed AAPG statement have been closed to non-members. Rabett Run posted some of the comments when they were open and Eli wonders if an AAPG member could do the same for later posts.

A somewhat discouraging marker of how the proposed document was watered can be found by comparing a part of the draft
Public concern over the potential impacts of climate change is growing because observations demonstrate that the planet has been warming since the middle to late 19th century and increasingly sophisticated climate models predict increased future warmth (IPCC 2007). These conclusions have been articulated mainly by climate scientists, through reports of the National Academy of Sciences, American Geophysical Union, American Association for the Advancement of Science, and the American Meteorological Society.
to the final document on the same point
Certain climate simulation models predict that the warming trend will continue, as reported through NAS, AGU, AAAS, and AMS. AAPG respects these scientific opinions but wants to add that the current climate warming projections could fall within well-documented natural variations in past climate and observed temperature data. These data do not necessarily support the maximum case scenarios forecast in some models. To be predictive, any model of future climate should also accurately model known climate and greenhouse gas variations recorded in the geologic history of the past 200,000 years.
One wonders where the AAPG found climate simulation models that do not predict the warming trend will continue, have they been consulting with Piers Corbyn and Co, and then, of course we can haggle about accurately. Ethon, Eli has been told, is looking for his liver oil pill container and hopes to peck up a storm.


Thursday, August 30, 2007

The AAPG brings forth a mouse (which is better than a rat)


The American Association of Petroleum Geologists has issued its new policy on climate change. James Annan and Julia Hargreaves will be very happy

Stand up and be counted (after you pay your dues..)


The AGU is revising its position statements on Teaching Evolution, Human Impacts on Climate and Natural Hazards. The statement on Teaching Evolution, originally agreed in 1981 and last revised in 2003 states

The American Geophysical Union affirms the central importance of scientific theories of Earth history and organic evolution in science education. An educated citizenry must understand these theories in order to comprehend the dynamic world in which we live and nature's complex balance that sustains us. . .
"Creation science" is based on faith and is not supported by scientific observations of the natural world. Creationism is not science and does not have a legitimate place in any science curriculum.
AGU opposes all efforts to require or promote teaching creationism or any other religious tenets as science. AGU supports the National Science Education Standards, which incorporate well-established scientific theories including the origin of the universe, the age of Earth, and the evolution of life.
Comments can be left after registration

The statement on Human Impacts on Climate issued in late 2003 starts
Human activities are increasingly altering the Earth's climate. These effects add to natural influences that have been present over Earth's history. Scientific evidence strongly indicates that natural influences cannot explain the rapid increase in global near-surface temperatures observed during the second half of the 20th century.
Comments can be left after registration

The policy on Natural Hazards was first issued in 1995 and reaffirmed in 2005
Natural hazards (earthquakes, floods, hurricanes, landslides, meteors, space weather, tornadoes, volcanoes, and other geophysical phenomena) are an integral component of our dynamic planet. These can have disastrous effects on vulnerable communities and ecosystems. By understanding how and where hazards occur, what causes them, and what circumstances increase their severity, we can develop effective strategies to reduce their impact. In practice, mitigating hazards requires addressing issues such as real-time monitoring and prediction, emergency preparedness, public education and awareness, post-disaster recovery, engineering, construction practices, land use, and building codes. Coordinated approaches involving scientists, engineers, policy makers, builders, lenders, insurers, news media, educators, relief organizations, and the public are therefore essential to reducing the adverse effects of natural hazards.
Comments can be left after registration

Here and back again. . .

An interesting discussion on open access continues both here and on Deltoid. One tdawwg has had, I think the better of the argument, and there are two points of his which Eli wishes to both agree and disagree with

So why is market regulation to recoup costs so abhorrent? And I would argue that however publicly funded research may be, there is a substantial individual contribution that renders the scholarly work individual, not public, property.

and

The idea that academics don't need to publish in peer-reviewed journals is not disingenuous. The system we have now hasn't existed forever: it was arrived at consensually, with many parties agreeing and disagreeing over how it should work, who does what, etc. I see no reason why the intellectual elite can't come up with an acceptable alternative if they find that the restrictions of paying for copyrighted content are too much for them, are morally odious, etc.
To really understand what is happening one needs to know a few things about scientific publishing. This post is somewhat of a backgrounder.

When Eli as a young and rather small underbunny sat at the feet of a great Hare. Big Foot occassionaly remarked in passing that post WWII it was obvious that scientific research in the US was going to be a huge and important thing driven by government funding. The great and good sat with the political types and all realized that this would result in an explosion of academic publication with increasing stress on libraries to keep up. They thought large thoughts about how to fund it quickly realizing that there were several possibilities:

  • Direct funding of academic presses and/or scientific organizations (AAAS, etc)
That would leave the commercial presses out in the cold, which was a big communist type no-no. Or what we have now:
  • Subvention of the academic presses through page charges paid by the authors from their grants
  • Subvention of the libraries through overhead (now called F&A or facilities and administrative) charges
  • Expensive journals from commercial publishers.

Almost every grant has a couple of thousand $ or more per year for page charges. What are page charges you ask, well they are an amount that the authors pay per article/per page to cover some of the costs of publications. Most scientific organizations have page charges for their publications, and there are arrangements where the needy (or whiny) can have them forgiven. The National Academy policy is both typical and indicative of how such organizations are trying to meet the challenge of open access

PNAS depends, in part, on the payment of page charges for its operation. Payment of the page charge of $70 per printed page will be assessed from all authors who have funds available for that purpose. Authors will be charged for extensive alterations on proofs. Payment of $250 per article will be assessed for Supporting Information. Authors of research articles may pay a surcharge of $1,100 to make their paper freely available through the PNAS open access option. If your institution has a 2007 Site License, the open access surcharge is $800. All articles are free online after 6 months. Articles are accepted or rejected for publication and published solely on the basis of merit.

Payment by authors of the following additional costs is expected: $325 for each color figure or table; $150 for each replacement or deletion of a color figure or table. A single figure is defined as original art that can be processed as a unit and printed on one page without intervening type. Requests for waiver of charges should be submitted to pnas@nas.edu
The AGU "basic publication fee" (PC for page charge) structure is more complicated. Google "pages charges" and you will come up with a bundle of these policies and a severe case of MIGO.

When you go through the exercise the learned society (AIP, ACS, AGU, RSC, etc.) have pretty reasonable policies and subscription fees and are pretty close to break even on their publishing through the combination. Demanding that they go open access without another funding mechanism will destroy them.

On the other hand commercial presses, such as Elsevier (aka Darth Publisher) simply stick it to the libraries. The libraries are up against it with increasing subscription rates. Eli's place has been triaging journal subscriptions for the last ten years and it is really tight now. This letter to the faculty from the University of Maryland Libraries gives you a fair picture of what is happening:

As detailed in the Provost's letter, in 2003 Elsevier maintained a negotiating stance with the Libraries that failed to meet the Libraries' criteria for control over collection decisions and for the ability to exercise prudent management of rapidly escalating subscription costs.

Elsevier wanted the Libraries to commit to an entire set of journals whereas the Libraries wanted to subscribe to individual titles and to retain the authority to cancel subscriptions as necessary. When the Libraries opted out of the package arrangement, Elsevier raised its 2004 prices an average of 27% per title.

The Libraries will scrutinize Elsevier subscriptions carefully and will exercise its right to make title-by-title subscription decisions. All publications from Elsevier warrant this careful attention since their prices increase at such a rapid rate, well over the rate of inflation. Furthermore, the Libraries spend roughly 1.5 million dollars for Elsevier subscriptions. This amount accounts for 43% of all journal expenditures, but only 8% of the total number of current journal subscriptions. The Libraries need to ensure that these titles are bringing real value to the campus.

Usage data tallied for 2004 and cost per use calculations will inform subscription renewal decisions this year.

  • The average use per Elsevier title in 2004 was 226.
  • The average cost per use in 2004 was $9.27.
Further, a letter to the MIT community

“…we are concerned about the pressures exerted on the scholarly publishing system by a small number of highly profitable commercial publishers concentrating in science and technology journals. These publishers lock libraries into high-priced packages for combined print/electronic output, and contractually constrain libraries’ ability to manage expenditures. Libraries must invest a continually larger percentage of their budgets in providing access to these publications.”

Professor Marcus Zahn, Chair of the Faculty Committee on the Library System, The MIT Faculty Newsletter, Dec.-Jan., 2003
Our favorite boat anchor is Tetrahedron Letters, $12.8K/yr for one journal, one that we have to have to maintain our ACS accreditation.

The bottom line is that for open access to work, research funding organizations will have to pay considerably more than they do now and authors will have to stay away from the commercial publishers who currently control key titles. Eli is not opposed to any of this, but he is not a raw enough Rabett to think that this will occur simply and without a fur fight.

Tuesday, August 28, 2007

Why librarians want to kill libertarians

There is a rumor that information wants to be free, and the open access movement is gathering steam. The mantra is that the results of publicly funded research should be free to all. Tim Lambert touched this off by pointing to a particularly stupid screed against open access. This produced the usual posturing from the anything I can grab is mine libertarian crowd.

Eli, a consumer of carrots and science papers, and rather cranky at the moment, has no strong opinion in the abstract. On the other hand he knows enough librarian avengers to understand that the base issue is who guarantees that the journals will be available forever.

Electronic databases of journal articles are fundamentally different from print. Print archives are found at multiple libraries, each of which has an institutional obligation to maintain them in the face of declining budgets and space (ever wonder why librarians love microfiche?). For a significant journal, such as JACS, Phys. Rev., etc., there will be many hundreds of complete archives up to the point where the libraries stop taking the printed editions. True you can search the earth for the Journal of the Montana Academy of Science, but inter-library loans can even get you that.

Electronic databases of journal articles reside in one place and are distributed on the Web.

What guarantees that the archive will exist 50 years from today? If Elsevier closes Science Direct down because it can't make the money it wants on it libraries that have switched over to electronic access only wake up with huge holes in their collections. In some cases where the material only exists as electrons everyone has lots of nothing. Librarians are all too aware of these issues which is why they are not greeting the open access movement with huzzahs. Before open access can actually happen, the archive issue has to be satisfied, which means that someone has to come up with the money to fund the archive in perpetuity.

This is not a problem that will be solved by volunteers nor is it one to be solved on the cheap

Sunday, August 26, 2007

Station of the day: Farmington ME


Courtesy of the Kristan Byrnes Science Foundation and Surfacestations.org

Another demonstration of the cooling bias in the USHCN temperature anomaly record.

Tuesday, August 21, 2007

Cool station of the day

As has been pointed out by others, Tony Watt's surface station site features the hot, which bothers many readers. Several really good posts have asked whether they really are so hot, and whether this makes a difference in the long run, a station that is hotter than the surrounding area being balanced by one(s) that are cooler. Eli and the bunnies are starting a new feature "Cool station of the day"

Now where would a Rabett find a cool US weather station? Perhaps where the most cooling has been seen in the US, the southeast, and yo there it is, the whole package, Bainbrige GA, a GISS rural station,


UPDATE: The rake in the face crowd demands to see the temperature data.


Like Eli told you real cool. For fun, think of how the as nearby trees grow over the years, the amount of shade increases linearly leading to increasing cooling.

Monday, August 20, 2007

No Exit

Jean Paul SarteSartre taught the bunnies that hell was the people you had to spend eternity with. He was wrong. Hell is Philadelphia International Airport with the USAIR grim reaper training class canceling flights to every destination. Terminal F being the lowest circle, we are now scheduled to board a bus somewhere in the wee hours that will circle the airport endlessly. Like poor Charlie, Eli may never return.

However, to keep you amused here is an interesting picture of a surface station, the one that Eli knew when he was a SarteSartre fan, walking the streets of the Village, being cool (well he tried) and all that.


Eli recalls walking into Central Park, near the Belvedere Castle to go see Joe Papp's Shakespeare in the Park productions and the huge change in temperature as one left Fifth Avenue, and how the weather station was located in a lovely, leafy grove. See you one air conditioner

UPDATE Those who must be obeyed pointed out that Eli had forfeited any claim to pseudo intellectual appearance by misspelling Sartre. Au contraire mon mice, this only nails the sucker to the wall. For pointing this out the anonymouse wins the hall of hell (Philadelphia International Airport) fun alarm. A 220 dB tooth extractor that used to hang over the baggage carousel that refused to spit up our stuff because it had been sitting out in the rain for four hours and didn't taste good. We've also relinked the picture so that all can see.

Friday, August 10, 2007

Help

Eli is being held prisioner by Ms. Rabett and forced to vacation. Back on Aug 21 unless briefly paroled to an Internet cafe

Saturday, August 04, 2007

Trashburning dynamics

Heat flow by convection can be visualized by Schlieren photography in which density differences can be clearly seen. Schlieren photography is closely related to what we commonly refer to as watching the heat rise off hot asphalt, but is much more sensitive (a paper by Gary Settles gives several examples). Horatio Algeranon (a very punny anonymouse) picked up on this, and found a picture showing that the heat flow from a charcoal grill is pretty much straight up. But even Ethon knew this, if he stands to the side when grilling his liver McClimateAudit burgers, things are relatively cool, but bend over and put his beak above the coals, and sure enough it gets fried.

Which brings up to one of Anthony Watts' favorite surface station views


so how does the heat flow


straight up, heating of the air on the sides in contact with the barrel is minimal as seen by the lack of structure.

We have heard a lot about AC units. We even have the famous Marysville picture

Eli walked by a large one yesterday, there was very little airflow a few feet to the side. Schlieren shows the same

Friday, August 03, 2007

You say tomato, I say tomahto


Brian Schmidt has an interesting post over at Back Seat Driving which Eli would encourage all to go read. Tokyo Tom, from the old Prometheus gang pointed Brian to a recent paper by Jim Hansen. Hansen's hair is on fire. He and his co-authors think that we are VERY close to a non-linear transition to out of control sea level rise as the Greenland and West Antarctic ice caps start to disintegrate. You can read about that on Brian's blog and in the paper. Brian points to a suggestion from Hansen, et al.

We conclude that a feasible strategy for planetary rescue almost surely requires a means of extracting GHGs from the air. Development of CO2 capture at power plants, with below-ground CO2 sequestration,may be a critical element. Injection of the CO2 well beneath the ocean floor assures its stability (House et al. 2006). If the power plant fuel is derived from biomass, such as cellulosic fibres5 grown without excessive fertilization that produces N2O or other offsetting GHG emissions, it will provide continuing drawdown of atmospheric CO2.
about which
Tokyo Tom and I disagree somewhat about the last paragraph. He thinks it lends support for open-air carbon capture, the approach favored by Roger Pielke Jr. and the only semi-mainstream idea more speculative than geoengineering. I think Hansen's referring to carbon sequestration from biomass power generation, which is a means of extracting GHGs from the air.
Eli would have commented about this at Back Seat Driving, but comments appear to be turned off, or the Rabett has taken his stupid pills. It appears to Eli that they are both right, which is why the suggestion is elegant. Plants extract CO2 from the atmosphere on balance and convert it to biomass. The are evolved to work with low concentrations of CO2. In that sense TT is right, the plants are efficient at open air capture. By burning the biomass in a power plant the CO2 is captured in the smokestack where it is concentrated. This proposal separates the capture (diffuse) from the sequesterization (concentrated), optimizing each step. In the diffuse capture step plants are much more efficient and lower cost than the various liver in the sky schemes that have been suggest. The gas in a smokestack given efficient combustion, is almost completely water vapor and CO2. The former can be condensed, leaving almost pure CO2 to be sequestered.

Thursday, August 02, 2007

Sgt Rabett patrols the comments

Our mission at Rabett Run is to give the anonymice the free run necessary for a great blog. Unfortunately we have begun to pick up commercial spam at an increasing rate and may have to put the captcha feature back on.

Eli is insanely jealous of Michael Tobis who found this panel first at Climate Cartoons

BTW, it takes a bunch of insanely factitious anonymice working the comments to really make a great blog.

Wednesday, August 01, 2007

Watts up Doc?


UPDATE from on the road: Eli has been off planet for a week. Ms Rabett has taken control, but she is fluffing in the shower and we are in a place with wireless. Anyhow, brief looking about shows that Steve McIntyre has found a mistake in some of the GISS adjustments (actually Eli does not even know if the mistake was with the GISS or the USHCN bunches, as Climate Audit appears to be off the air because of a DRDOS attack, or at least that is what they say).

However, junior management wishes to point out that as we pointed out below, the issue was not the physical layout of the stations, Tony Watts' and Roger Pielke Sr. thing. After going through the metadata about Detroit Lakes, Eli concluded there was a problem, but the problem had to be in the adjustments. Eli, being the lazy Rabett, and ear deep in work at the time left it at that without looking into the matter. McIntyre found one, which from the comment slipstream appears to have been fairly trivial (sort of like Spencer and Christy's minus sign), but, as Tony pointed out and is quoted below)

But hey, they can "fix" the problem with math and adjustments to the temperature record.
They did.
--------------------------------------------------------------
Tony Watt's surface station watchers have landed a whopper, Detroit Lakes, Mn, a rural station in western Minnesota (ID: 212142)


As he says
This picture, taken by www.surfacestations.org volunteer Don Kostuch is the Detroit Lakes, MN USHCN climate station of record. The Stevenson Screen is sinking into the swamp and the MMTS sensor is kept at a comfortable temperature thanks to the nearby A/C units.
According to Don Kostuch, the AC unit was moved from the roof of the building 5/99 and the chart from GISS (uncorrected USHCN data) shows ~ 4C jump about 1999


This has everyone (well isn't Climate Audit everyone) jumping up and down and has even made it over to Germany

Much speculation.
Knashing of Hansen
We codda done it better

Ah, but little bunnies, if we actually go and get the data from GISS or from CDIAC (sadly in F) we see that the jump

Year GISS CDIAC Mo.
Miss.
1990 3.92 39.71
1991 3.75 39.46 1
1992 999.9 38.81 7
1993 999.9 37.46 12
1994 999.9 38.94 6
1995 3.68 37.81
1996 1.59 34.94
1997 999.9 38.57 4
1998 6.4 43.52
1999 6.93 44.72
2000 7.58 42.73
2001 6.54 43.71
2002 5.7 40.71
2003 5.42 40.36
2004 5.52 40.21
2005 6.37 42.04

really comes in 1997/1998. The lab bunnies, who do RTFR also noted that there were a whole bunch of months missing in 1997 and earlier in the decade, (USHCN fills in even long stretches, GISS 999.99s them out) so they went to the historical record for Detroit Lakes and they saw that the station moved from one side of the lake to the other August 30, 2002. The satellite picture shows no building near the old site. Thus the jump happened two years before the station moved to its current location near the air conditioner.

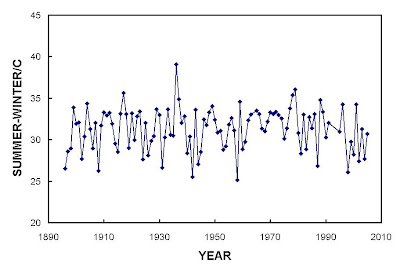
UPDATE: Eli and the bunnies want to drive a stake into that air conditioner theory. Detroit Lakes is in rural western Minnesota. They do not run A/C during the winter. It is too cold for a heat pump. If there were any effect from the A/C it would raise the temperature during the summer. Let us look at the difference between the summer (J-J-A) and the winter (D-J-F). Listening to the ranting anonymice there should be a jump when the A/C was installed (1999)

Guess not.

Well what about that scuzzy Stevenson screen. August 11, 2006 the max/min thermometer was replaced by the MMTS sensor. Nothing under the screen, why pay any attention to it. One might speculate that when they put in the automatic MMTS they pushed it to the side and left it. The shelter has since gone through a Minnesota winter. Eli, a plush white Rabett, would look like that after one of those suckers.

So what DID happen in 97/98 according to the historical record?

Two things. On January 1, 1997 the station was moved to another management section and it looks like the time of observation changed from 17:00 to 7:00 and on July 16 1998 the observer changed.

Looks like a lot of the new anonymice were wrong when they thought a photograph alone was important. Of course, we are depending on the station historical record available to everyone through the majic of the INTERTUBES. Still, there does appear to be a problem here, IEHO associated with an imperfect homogeneity adjustment
Currently all data adjustments in the USHCN are based on the use of metadata. However station histories are often incomplete or changes that can cause a time series discontinuity, such as replacing a broken thermometer with one that is calibrated differently, are not routinely entered into station history files. Because of this we are developing another step in the processing that will apply a time series discontinuity adjustment scheme described in Peterson and Easterling (1994) and Easterling and Peterson (1995). This methodology does not use station histories and identifies discontinuities in a station's time series using a homogeneous reference series developed from surrounding stations.
Eli will let Tony Watts have the last word, because at least he got it right
But hey, they can "fix" the problem with math and adjustments to the temperature record.

For the younger bunnies

Its getting hot in here is a group climate blog for the younger set

It’s Getting Hot in Here is the strong voice of a growing movement, a collection of voices from student and youth leaders of the global movement to stop global warming. Originally created by youth leaders to allow youth to report from the International Climate Negotiations in Montreal, It’s Getting Hot in Here has since grown into a global online community, with over 90 writers from countries around the world.
worth pondering.

Tuesday, July 31, 2007

First hurricane paper of what promises to be a busy season

Holland and Webster in the Philosophical Transactions of the Royal Society

We find that long-period variations in tropical cyclone and hurricane frequency over the past century in the North Atlantic Ocean have occurred as three relatively stable regimes separated by sharp transitions. Each regime has seen 50% more cyclones and hurricanes than the previous regime and is associated with a distinct range of sea surface temperatures (SSTs) in the eastern Atlantic Ocean. Overall, there appears to have been a substantial 100-year trend leading to related increases of over 0.78C in SST and over 100% in tropical cyclone and hurricane numbers. It is concluded that the overall trend in SSTs, and tropical cyclone and hurricane numbers is substantially influenced by greenhouse warming. Superimposed on the evolving tropical cyclone and hurricane climatology is a completely independent oscillation manifested in the proportions of tropical cyclones that become major and minor hurricanes. This characteristic has no distinguishable net trend and appears to be associated with concomitant variations in the proportion of equatorial and higher latitude hurricane developments, perhaps arising from internal oscillations of the climate system. The period of enhanced major hurricane activity during 1945–1964 is consistent with a peak period in major hurricane proportions
It's a hot time out there in the Atlantic today

and the Gulf is turning into a hibatchi.


Those of you without access to Phil. Trans. can read a preprint version

Monday, July 30, 2007

There's a hot time in Marysville or how not to RTFR

Eli, as many others has been blogging about the surface station record. The pin up picture is Marysville
which "obviously shows spurious warming due to the urban heat island effect". Well, maybe not. Tamino has put up the numbers, using the GISSTEMP adjusted data that compares Marysville to nearby Orland, a rural station and shows they have the same trend over the last 30 years.


There has been lots of comment on these two stations, including Climate Audit from which the Orland figure was taken with a constant stream of stuff like this from another blog about Marysville

I can tell you with certainty, the temperature data from this station is useless. Look at the pictures to see why, and is it any wonder the trend for temperature is upward?
There are also micro mistakes
But let’s say that they got all their adjustments exactly right. What does that say about the quantum of UHI? Here’s a town of 12,000 which qualifies as “rural” in all the UHI studies.
sadly no. Steve blew that one, Marysville is NOT qualified as rural in GISS, and GISS is very clear about how rural stations are picked, by examining satellite data to find unlit areas where there are weather stations. The downside of this is that only ~250 rural stations are found in the US. Data for all the other stations is adjusted by
The urban adjustment in the current GISS analysis is a similar two-legged adjustment, but the date of the hinge point is no longer fixed at 1950, the maximum distance used for rural neighbors is 500 km provided that sufficient stations are available, and “small-town” (population 10,000 to 50,000) stations are also adjusted. The hinge date is now also chosen to minimize the difference between the adjusted urban record and the mean of its neighbors. In the United States (and nearby Canada and Mexico regions) the rural stations are now those that are “unlit” in satellite data, but in the rest of the world, rural stations are still defined to be places with a population less than 10,000. The added flexibility in the hinge point allows more realistic local adjustments, as the initiation of significant urban growth occurred at different times in different parts of the world.
Hansen, J.E., R. Ruedy, Mki. Sato, M. Imhoff, W. Lawrence, D. Easterling, T. Peterson, and T. Karl, 2001: A closer look at United States and global surface temperature change. J. Geophys. Res., 106, 23947-23963, doi:10.1029/2001JD000354
ONLY RURAL STATIONS CONTRIBUTE TO THE TREND IN GISSTEMP. Marysville has NO EFFECT on the long term trend in the GISSTEMP record.

You have to RTFR to understand what is happening. Let us look at the USHCN adjusted and the GISS adjusted data
The RAW data is below the adjusted. That means that the nearby RURAL stations are warming faster than that so called hot spot Marysville. We can also look at the simple differences to see the hinged corrections.

RTFRs folks, Eli has enough aggro.

UPDATE: Stephen McIntrye asks where it is specifically stated that only the 250 or so rural US stations are used by GISS to estimate trends. Referring to the 2001 GISS paper linked above we see in the introduction (Eli quoted this before)
Only 214 of the USHCN and 256 of the GHCN stations within the United States are in “unlit” areas. Fortunately, because of the large number of meteorological stations in the United States, it is still possible to define area-averaged temperature rather well using only the unlit stations. This is not necessarily true in much of the rest of the world.
There is also an interesting comment re land use (e.g. why not adjust for land use effects as well as UHI in Section 4.2
We provide one explanatory comment here about the rationale for trying to remove anthropogenic urban effects but not trying to remove regional effects of land use or atmospheric aerosols. Urban warming at a single station, if it were not removed, would influence our estimated temperature out to distances of about 1000 km, i.e., 1 million square kilometers, which is clearly undesirable. This is independent of the method of averaging over area, as even 5000 stations globally would require that each station represent an area of the order of 100,000 square kilometers, an area much larger than the local urban influence. On the other hand, anthropogenic land use and aerosols are regional scale phenomena. We do not want to remove their influence, because it is part of the largescale climate.
which should amuse Prof. Pielke a. D. but back to the points that SM asked about while torturing surface stations (Eli has the feeling he is not being treated well over their also). From Section 4.2.2
Indeed, in the global analysis we find that the homogeneity adjustment changes the urban record to a cooler trend in only 58% of the cases, while it yields a warmer trend in the other 42% of the urban stations. This implies that even though a few stations, such as Tokyo and Phoenix, have large urban warming, in the typical case, the urban effect is less than the combination of regional variability of temperature trends, measurement errors, and inhomogeneity of station records.
The bottom line is that since the urban and periurban stations have their temperatures adjusted so that the trends match those of the "nearby (500 km)" rural stations, the long term trend is only determined by the rural stations. The point raised in an earlier post, "Does GISSTEMP overcount rural stations"
The bottom line is that the ONLY stations which contribute to the overall trend are the RURAL stations. Moreover, rural stations near heavily settled areas will be more strongly overcounted because the trends in the few rural stations in such an area will dominate all of the stations in the area and the nearby points on the grid to which the temperature data is fit.
To put it simply, the grid point temperature anomalies may be an average over all stations in the neighborhood, but the data in the non-rural stations has been previously constrained to match the trends of the rural stations. Thus the rural trends are being added multiple times to the average. What is left is shorter time variations that average to zero over the hinged UHI spline adjustments.

In the long run it does make a difference over 100 years, but not such a large difference that it would swamp warming from forcings such as greenhouse gases, solar, etc..
The primary difference between the USHCN and the current GISS adjustments, given that the GISS analysis now adapts the USHCN time of observation and station history adjustments, is the urban adjustment. The GISS urban adjustment, as summarized in Plate 2, yields an urban correction averaged over the United States of about -0.15°C over 100 years, compared with a USHCN urban adjustment of -0.06°C. When only urban stations are adjusted the impact of our adjustment is about -0.1°C on either the USHCN stations (Plate 2j) or on the GHCN stations (Plate 2k) in the United States. When both urban and periurban stations are adjusted, the impact is about - 0.15°C.

The magnitude of the adjustment at the urban and periurban stations themselves, rather than the impact of these adjustments on the total data set, is shown in Plate 2l. The adjustment is about -0.3°C at the urban stations and -0.1°C at the periurban stations. In both cases these refer to the changes over 100 years that are determined by adjusting to neighboring “unlit” stations. The adjustments to the periurban stations have a noticeable effect on the U.S. mean temperature because of the large number of periurban stations, as summarized in Table 1.

Saturday, July 28, 2007

Slouching toward Gomorrah

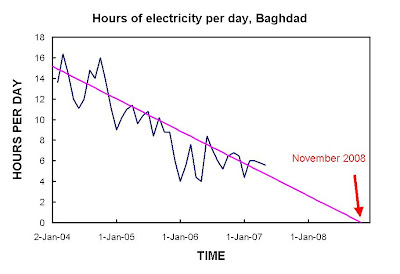
Tim Lambert has an update on the hours of electricity in Baghdad. The US State Department has decided to stop reporting on this. Eli thought it would be useful to see when the lights will finally go out on the Iraqi disaster. The answer is not surprising.

Friday, July 27, 2007

The Stern Gang rides again

Eli opened up his July 13 issue of Science Magazine and read articles by William Nordhaus and Nicholas Stern on the Stern Report. There is not much new to report to those who have been following the argument. Nordhaus is still flogging his ramp

What is the logic of the ramp? In a world where capital is productive and damages are far in the future (see chart above), the highest-return investments today are primarily in tangible, technological, and human capital. In the coming decades, damages are predicted to rise relative to output. As that occurs, it becomes efficient to shift investments toward more intensive emissions reductions and the accompanying higher carbon taxes. The exact timing of emissions reductions depends on details of costs, damages, learning, and the extent to which climate change and damages are nonlinear and irreversible.
and criticizing Stern's discounting. Nordhaus assumes that most of the damages from climate change will occur after 2200, so costs in the next 200 years will be low. Under this assumption if one uses higher discount rates more typical of those in economic models

The optimal carbon tax and the social cost of carbon decline by a factor of ~10 relative to these consistent with the Stern Review's assumptions, and the efficient trajectory looks like the policy ramp discussed above. In other words, the Stern Review's alarming findings about damages, as well as its economic rationale, rest on its model parameterization--a low time discount rate and low inequality aversion--that leads to savings rates and real returns that differ greatly from actual market data. If we correct these parameterizations, we get a carbon tax and emissions reductions that look like standard economic models.

The Stern Review's unambiguous conclusions about the need for urgent and immediate action will not survive the substitution of assumptions that are consistent with today's marketplace real interest rates and savings rates. So the central questions about global-warming policy--how much, how fast, and how costly--remain open.

The last point, that market discount rates are appropriate is one that is contested by Nicholas Stern.

Many of the comments on the review have suggested that the ethical side of the modeling should be consistent with observable market behavior. As discussed by Hepburn, there are many reasons for thinking that market rates and other approaches that illustrate observable market behavior cannot be seen as reflections of an ethical response to the issues at hand. There is no real economic market that reveals our ethical decisions on how we should act together on environmental issues in the very long term.

Most long-term capital markets are very thin and imperfect. Choices that reflect current individual personal allocations of resource may be different from collective values and from what individuals may prefer in their capacity as citizens. Individuals will have a different attitude to risk because they have a higher probability of demise in that year than society. Those who do not feature in the market place (future generations) have no say in the calculus, and those who feature in the market less prominently (the young and the poor) have less influence on the behaviors that are being observed.

Another recurring point is that
The ethical approach in Nordhaus' modeling helps drive the initial low level of action and the steepness of his policy ramp. As future generations have a lower weight they are expected to shoulder the burden of greater mitigation costs. This could be a source of dynamic inconsistency, because future generations will be faced with the same challenge and, if they take the same approach, will also seek to minimize short-term costs but expect greater reductions in the future as they place a larger weight on consumption now over the effects on future generations (thus perpetuating the delay for significant reductions).
Something that Mark Thoma comments on when pointing out that Robert Samuelson plays Intellectual Three Card Monte with Lubos Motl .
In my view, Robert Samuelson is a bad person: when a carbon tax was on the agenda and we had a real window of opportunity, he fought it; now when the only things on the agenda are preference-shaping tools that I regard as very weak compared to a carbon tax, he's against them as well on the grounds that "hippie... Prius politics is... showing off" and that a carbon tax would be good. A little intellectual three-card-monte here, doncha think?
A principal values of the Nordhaus and Stern articles are links to papers and book chapters available on the net for those seeking more detail.
  1. W. D. Nordhaus, "The Challenge of Global Warming: Economic Models and Environmental Policy" (Yale Univ., New Haven, CT, 2007); available at http://nordhaus.econ.yale.edu/recent_stuff.html.
  2. W. D. Nordhaus, J. Econ. Lit., in press; available at http://nordhaus.econ.yale.edu/recent_stuff.html.
  3. K. J. Arrow et al. Climate Change 1995--Economic and Social Dimensions of Climate Change, http://nordhaus.econ.yale.edu/stern_050307.pdf
  4. T. Sterner, U. M. Persson, "An even sterner review: Introducing relative prices into the discounting debate," Working draft, May 2007; www.hgu.gu.se/files/nationalekonomi/personal/thomas%20sterner/b88.pdf
  5. C. Hepburn, "The economics and ethics of Stern discounting," presentation at the workshop the Economics of Climate Change, 9 March 2007, University of Birmingham, Birmingham, UK; www.economics.bham.ac.uk/maddison/Cameron%20Hepburn%20Presentation.pdf
  6. N. Stern, "Value judgments, welfare weights and discounting," Paper B of "After the Stern Review: Reflections and responses," 12 February 2007, Working draft of paper published on Stern Review Web site; www.sternreview.org.uk
  7. N. Stern, "The case for action to reduce the risks of climate change," Paper A of "After the Stern Review: Reflections and responses," working draft of paper published on Stern Review Web site, 12 February 2007; www.sternreview.org.uk.

Thursday, July 26, 2007

Does GISSTEMP overcount rural stations?

In a previous post, Eli quoted from Hansen, J.E., R. Ruedy, Mki. Sato, M. Imhoff, W. Lawrence, D. Easterling, T. Peterson, and T. Karl, 2001: A closer look at United States and global surface temperature change. J. Geophys. Res., 106, 23947-23963, doi:10.1029/2001JD000354 as to how the GISSTEMP team adjusts urban data

The urban adjustment in the current GISS analysis is a similar two-legged adjustment, but the date of the hinge point is no longer fixed at 1950, the maximum distance used for rural neighbors is 500 km provided that sufficient stations are available, and “small-town” (population 10,000 to 50,000) stations are also adjusted. The hinge date is now also chosen to minimize the difference between the adjusted urban record and the mean of its neighbors. In the United States (and nearby Canada and Mexico regions) the rural stations are now those that are “unlit” in satellite data, but in the rest of the world, rural stations are still defined to be places with a population less than 10,000. The added flexibility in the hinge point allows more realistic local adjustments, as the initiation of significant urban growth occurred at different times in different parts of the world.
In the US, they used satellite observations of night lights to define what are rural, suburban and urban areas:
The percent of brightness refers to the fraction of the area-time at which light was detected, i.e., the percent of cloud-screened observations that triggered the sensor. These data are then summarized into three categories (0-8, 8-88, and 88-100%). From empirical studies in several regions of the United States, Imhoff et al. associate the brightest regions (which we designate as “bright” or “urban”) with population densities of about 10 persons/ha or greater and the darkest (“unlit” or “rural”) regions with population densities of about 0.1 persons/ha or less. As is apparent from Plate 1b, the intermediate brightness category (“dim” or “periurban”) may be a small town or the fringe of an urban area.
after this classification the number of rural stations in the US is reduced to 214 USHCN stations and 256 of the GHCN stations (obviously a lot of duplication here)
As the contiguous United States covers only about 2% of the Earth’s area, the 250 stations are sufficient for an accurate estimate of national long-term temperature change, but the process inherently introduces a smoothing of the geographical pattern of temperature change.
Outside of the US, they continue to use population data to define rural stations.

The bottom line is that the ONLY stations which contribute to the overall trend are the RURAL stations. Moreover, rural stations near heavily settled areas will be more strongly overcounted because the trends in the few rural stations in such an area will dominate all of the stations in the area and the nearby points on the grid to which the temperature data is fit.

Tuesday, July 24, 2007

UHI demythifications

Steve Bloom and Hank Roberts points out that Control Climate Change copied their post which Eli linked to in the original post here, verbatim from Real Climate.

http://www.realclimate.org/index.php/archives/2007/07/no-man-is-an-urban-heat-island/#

Control Climate Change has a notice at the bottom of their web page
http://www.controlclimatechange.com/2007/07/20/no-man-is-an-urban-heat-island/

copy; 2007 Control Climate Change and Crossbow Communications. All Rights Reserved.
Since they copied Real Climate's work without permission, they clearly cannot claim copyrights or any rights about the text. Crossbow Communications is a public relations firm located in Denver run by one
Gary Chandler
Crossbow Communications
PO Box 101413
Denver, Colorado 80250
303-278-2865
gary@crossbow1.com

Crossbow claims success in placing agitprop in a number of newspapers. They have represented mining and agricultural interests in the past. It was very naughty of them and I am not sure what is going on. I have written to them and we will see. Apologies. Paranoids are often right.

UPDATE: Hank got deeper into this while Eli was changing the post. See the comments.