Tuesday, May 30, 2006

Man bites dog......


stories are beloved in the press. We also know that the denialists believe that CO2 is life. Well, in some cases life can bite....

Rising levels of carbon dioxide—a so-called greenhouse gas that traps heat within Earth's atmosphere—can fuel booming poison ivy growth, a new study reports.

Even worse, the rash-inducing vines may become more potent.
At ~600 ppm CO2 poison ivy growth is about 150% faster than in today's ambient atmosphere and the active compound undergoes a chemical transformation and becomes more potent.

Which leaves the question of how much worse the ivy itches today because of those global climate change denialists. (snark off)


Monday, May 29, 2006

Parsing greenhouse gas driven sea level rise.....


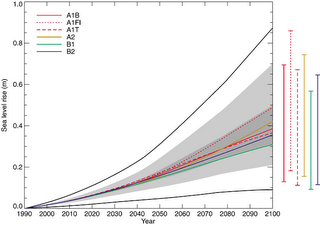
Is not trivial. We have seen the IPCC TAR predictions for sea level rise until 2100

where the dark band is the average of all of the GCM predictions over the 35 emission scenerios. This best estimate of 30 to 40 cm by 2100 is not very scary, although it is concerning. More concerning if you live in Florida than Colorado, but still it looks like it can be handled.

But wait, there is still more. If you look carefully (or read the text) you find that the rate of sea level rise increases in the second half of the 21st century by a factor of ~1.6 over that in the first. So, in the spirit of the second law of thermodynamics, it is going to get worse, before it gets better.

But there is STILL more, there is good evidence that there is a 50 - 100 year time lag for the global temperature due to the thermal inertia of the oceans, so, we are already committed to sea level rise, even if we stop emitting excess excess greenhouse gases today.

And since we are not going to stop emitting excess CO2 tomorrow, there is STILL MORE, if you look further out in time you get this prediction:

The top figure is the prediction for increasing CO2 by 1% a year for 70 years and then holding it constant, the bottom is for increasing CO2 by 1% a year for 140 years and then holding it constant. If the energy content of the atmosphere and ocean increases, it will take a long time to melt a lot of ice, and warm up the ocean, but melt and warm it will. That, is already a LOT of sea level rise. So it may not get better, but at least in a few hundred years it may not get worse.

BUT there MAY BE STILL MORE, we don't know a lot about the mechanics associated with ice sheets breaking apart. We assume that it will take millenia, but Hansen points out that it may only take centuries. That is a short enough time that if you hurry up and buy your Hummer now you may be able to screw your great grand kids. In Hansen's words:

A 20-meter sea level rise is not required to wreak havoc with civilization today. Three-quarters of a meter each from Greenland and Antarctica would do the job quite well.
Things may get a lot worse before they get better.

Sunday, May 28, 2006

What the devil are they doing in the Virgin Islands....


Tim Lambert is discussing the question of how much CO2 Al Gore generates. Besides being an opportunity for bad jokes this cries out for a bit of data. Eli went to the United Nations Statistics Division for some comparative international values. You can look up how the average person in your particular flyspeck does, but here are some comparative values:


Country annual/capita per day per day

metric ton kg lbs
Australia 18.3 50.1 110.3
Brazil 1.8 4.9 10.8
China 2.7 7.4 16.3
France 6.2 17.0 37.4
Germany 9.8 26.8 59.1
India 1.2 3.3 7.2
UK 9.2 25.2 55.5
US 20.9 57.3 126.0
Virgin Isl. 91.9 251.8 553.9


Eli, pointed out to Ms. Eli that he only generates 60% of his weight in hot air. Ms. Rabett replied that he should do better in both regards. Be that as it may, the interesting point about these figures is the difference between the UK and Germany on one hand and France on the other. Nuclear electrical generation appears to reduce CO2 emissions/capita by about a third.

Achenbach does a Colbert on Bill Gray. . . . .


Dear readers, take yourself over to the Washington Post where Joel Achenbach does a demolition of Bill Gray and bystanders.

IT SHOULD BE GLORIOUS TO BE BILL GRAY, professor emeritus. He is often called the World's Most Famous Hurricane Expert. He's the guy who, every year, predicts the number of hurricanes that will form during the coming tropical storm season. He works on a country road leading into the Front Range of the Rocky Mountains, in the atmospheric science department of Colorado State University. He's mentored dozens of scientists. By rights, Bill Gray should be in deep clover, enjoying retirement, pausing only to collect the occasional lifetime achievement award......
He's loud. His laugh is gale force. His personality threatens to spill into the hallway and onto the chaparral. He can be very charming.
But he's also angry. He's outraged.
He recently had a public shouting match with one of his former students. It went on for 45 minutes.
He was supposed to debate another scientist at a weather conference, but the organizer found him to be too obstreperous, and disinvited him.
Much of his government funding has dried up. He has had to put his own money, more than $100,000, into keeping his research going. He feels intellectually abandoned. If none of his colleagues comes to his funeral, he says, that'll be evidence that he had the courage to say what they were afraid to admit.
Which is this: Global warming is a hoax.....
In just three, five, maybe eight years, he says, the world will begin to cool again.
We sit in his office for 2 1/2 hours, until the sun drops behind the mountains, and when we're done he offers to keep talking until midnight. He is almost desperate to be heard. His time is short. He is 76 years old. He is howling in a maelstrom.
and much more. Perhaps you need too much background to get it, but you can hear the teeth grinding over at CEI and out to Colorado.

Monday, May 22, 2006

Touche....


Well a certain someone has threatened to cut Eli's ears off, and the NSA and all that is following everyone around, so, for the truly paranoid we recommend TOR an anonymouse net communication system from the Electronic Freedom Foundation. It does slow things up tho however some of the results are fun, for example, being rerouted to all the Googles in the world.

Did someone hear a seal bark?

Saturday, May 20, 2006

Banned in Boulder....


UPDATE 1/2/2007: Sometimes circumstance is fell. It turns out that one of Roger Pielke's children has a similar name to the one I used in this post which is now replaced by XXXX. This explains his negative reaction. For that I sincerely apologize. There was no intent or knowledge on my part about the child's name - Eli Rabett
------------------------------------------------------------------
Something that Eli said has really bothered Roger P, so it was Banned in Boulder. Should anyone be interested it was a response to this trio of statements from Andrew Dressler

Let's go back to what I said: "I would argue that there is a strong consensus that most of the warming over the last 50 years is likely due to human activities."
At the stated level of precision/uncertainty, there is no argument that a strong scientific consensus supports this statement ... do you disagree with either the statement or that a consensus exists, Roger?
Jim Clarke

All studies that attempt to determine the percentage of the recent warming that is man-made, use GCMs to make that determination. There are a significant number of well-qualified scientists who dispute that the GCMs have any skill (whether you like it or not). Therefore, there is still a significant debate as to how much of the recent warming is man-made.

and Roger Pielke, Jr.

You write, "There is no reasonable definition of "significant" that would allow one to truthfully say that "significant debate" is occurring over this statement."
Well the IPCC is debating this statement right now and is changing key parts of it from "most" to "dominant" and "likely" to "very likely" --- all that seems pretty significant.
To which I replied that the discussion reminded me of an old story. Andrew and XXXX were walking along a park path. XXXX jumped with shock when she saw a woman lying motionless in a pool of blood. Andrew went over and felt for a pulse, finding none, he said: XXXX this woman is certainly dead.
In another version Jim and XXXX were walking along the same park path. XXXX jumped with shock when she saw a woman lying motionless in a pool of blood. Jim grabbed her elbow and said: That is red wine she spilled, obviously a drunk, sleeping it off, let's go.
Finally Roger and XXXX were walking along the same park path. XXXX jumped with shock when she saw a woman lying motionless in a pool of blood. Roger said, not very interesting, we all know she is dead, but the real question is whose policy is to blame. If you read my paper (link provided) you will learn that it is all the fault of the criminologists.


Solving the climate change and budget problem in one go....


The US has a large budget deficit and low auto mileage. There are two ways the later problem could be solved. The first would be to mandate fleet mileage limits, but as we have seen this is a game that the auto companies play, the second would be EU level taxes on gas. Since the latter are regressive that must be accompanied by equivalent cuts on payroll taxes which are regressive. The net effect would be neutral or slightly progressive. If accompanied by lifting of the maximum earnings on which Social Security taxes are levied the effect would be to make the total tax system much more progressive, increase revenues and solve the Social Security funding issue into the far future.

Prof. Rabett's handy dandy all purpose maxisolution.

An Inconvient Truth and the Conventional Wisdom


The most sensible comment I have seen on "An Inconvenient Truth"

Mr. Gore clearly intends the exercise as an unconventional way to set off a public-policy debate. In New York, he'll be participating in a kind of town-hall meeting on global warming that coincides with the film's opening there. After that, "he's going to be out speaking on this issue and continue communicating on this issue," says Michael Feldman, an aide and adviser to the former vice president. Many of the proceeds from the movie are going to a new organization fighting climate change.
from the Wall Street Journal, and the conventional wisdom from the same source
That inevitably will raise the question of whether Mr. Gore intends the exercise to revive his political career. When the movie was previewed at the National Geographic Society's headquarters in Washington, an official there noted that the widespread reaction among Geographic employees who had seen the film earlier was: "Do you think he'll run again for president?" Mr. Gore responded with a dismissive wave of his hand.

Sunday, May 14, 2006

Quotes from Chairman Eli.....


I have a small suggestion for economists who want to see the effects of illegal immigration for themselves. Wherever you are find the local shape up, you know, the 7-11 where the landscaping and building contractors show up between 6 and 10 in the morning to pick up casual labor. Go down there and watch what happens. Then you can close your eyes and claim that these folks are not in your community, and yes, Virginia, they are depressing wages in that sector. Stick around and watch what the guys who don't get picked up do, it ain't pretty. The best way to handle the situation is to swallow deeply and set up a city/county run center with rules, but these are opposed by those who like having mown lawns and cheap kitchens. Like sausage, the populance has no stomach for seeing how it is made.

If you don't know where these places are in your city, then a) you have not been looking, b) just ask the guys who do your lawn or remodel your kitchen. If you can find a REAL old timer, ask him (and it will be a him in that case) how the ethnic identity of those doing casual labor has changed in the last 40-50 years.
Otherwise, don't bother talking to me about it. - Originally posted at Brad deLong's blog

And btw, if you are in a different country, the same rules apply.

Wednesday, May 10, 2006

Sea-level Rise Central


James Titus was one of the first, if not the first to think about the implications of climate change for sea level rise and how to meet that challenge. His private web site is an extraordinary resource with links to many primary references on the subject and his expert evaluation of the work.

The most amusing is a recording of "When the North Pole Melts" from 1988, created at the Climate Institute's "Preparing for Climate Change" conference that Ian Castles quoted from in starting Rabett down this little hole. Eli is working through the references before posting again on that issue, however you can gain a good idea of the situation by starting at Titus' Captain Sea Level's Links reading his comments and going through the links. If you don't have much time start at what Titus calls the EPA's mea culpa for having over-estimated future sea level rise during the 1980s and go on to a recent talk by Jim Hansen (the parenthetical comments are priceless). Since the origin of the set-to was in Australia, it is worth quoting a stanza from "When the North Pole Melts"

The Australian Labor Party wants to see the economy grow;
So their platform says that we will tow Santa from the Equator to the South Pole.
If the Russians will get him through the Bering Strait,
The currents can do rest.
But the Conservatives would rather that we make him wait,
And put him to the market test.
But What Will Santa Do?

Chorus

When the North Pole Starts to Melt?
What is gonna happen to his little elves?
Will they be too busy swimming to make the toys?
And what will Santa do?
If the North Pole melts too fast
Is this Christmas gonna be his last?
What will parents have to tell their girls and bays?
It sounds better than it reads. A classic in a capella science

Sunday, May 07, 2006

Always RTFR....

Always RTFR....

Ian Castles has responded.

You ask 'was the latter even printed?' Yes, the Director of the Office of Policy Analysis of the USEPA cited three multi-authored books that had appeared in 1983, 1985 and 1987. It is common for books to be printed.
The conference was sponsored by (among others) the Climate Institute, NOAA, the US Department of Energy, the US EPA, the National Science Foundation, NASA, the World Resources Institute and UNEP in cooperation with the Participating Agencies and Universities of the Canadian Climate Program. As might be expected, the Proceedings were printed.
In another presentation at the Conference, James Titus, Project Manager for Sea Level Rise at the EPA, presented a table showing that NASA's estimate of sea level rise was 70 cm by 2085 and that estimates by other authorieies of sea level rise to 2100 were: EPA, 56-345 cm; National Academy of Science, 50-200 cm.; and Hoffman et al, 57-368cm.
So the CONSENSUS view changed by a huge margin over a period of 13 years - it wasn't just one person's estimate
Eli's first thought was to point out that Castles was pointing to Morgenstern's impression of a consensus not a consensus. But then I remembered RTFR. Well, I don't have it, but I can probably get it tomorrow.

Still, Google is your friend, and you can find a lot of things if you know how to look. But before we do, let us remember that Castles claims the 1987 consensus (according to Morgenstern) was that by 2100 the global sea level will rise by 61-238 cm, while in 2000, the IPCC Third Assessment Report (TAR) consensus rise was 9-88 cm.

And gee, guess what I found. From the Intergovernmental Panel on Climate Change (IPCC). 1990. Potential impacts of climate change. Report of Working Group 2, Intergovernmental Panel on Climate Change, 1-1 to 2. Geneva: World Meteorological Organization (WMO)/United Nations Environment Programme (UNEP).
Global warming will cause a thermal expansion of the upper layers of the ocean and this expansion, together with the expected melting and movement into the ocean of some land-based glaciers, is expected to accelerate the current sea-level rise trend. A rise of 9-29 cm is expected over the next 40 years, or 28-98 cm by 2090 (Working Group I Report - Summary).
That's 1990 folks, from the First Assessment Report (FAR). Right in line with the "9-88" cm rise expected in the IPCC TAR ten years later and with the US National Academy report on Responding to Changes in Sea Level: Engineering Implications (1987) That's 1987 folks, the same time that Castles claims the consensus estimate is 61-238 cm. The second chapter of the report summarizes expert opinion on global temperature increases and the associated sea level rise. It concludes:
Apply these values to an estimated temperature change of 3.5 +/- 2 C due to a doubling of greenhouse gases over the next century, and the associate range in global mean sea level change is from 24 to 154 cm.
But there is more, let us go to the TAR, Figure 11.-2.

As the caption explains "The region in dark shading shows the range of the average of AOGCMs for all 35 SRES scenarios. The region in light shading shows the range of all AOGCMs for all 35 scenarios. The region delimited by the outermost lines shows the range of all AOGCMs and scenarios including uncertainty in land-ice changes, permafrost changes and sediment deposition" In other words, the dark shaded region (30-50 cm) is the most likely, the gray shaded region (20-70 cm) is somewhat least likely and the region between the two black lines (9-88 cm) encompasses the full range of possibilities. The core estimates are quite close to the FAR 28 - 98 cm. The high end estimate of 154 cm from the 1987 National Academy report has come down significantly, but then again the upper temperature limit from that report was 5.5 C as opposed to the 5.1 of the TAR.

You really do have to RTFR with these guys.

What should the IPCC do....


As many are aware, the US government has widely distributed the second order draft of the fourth IPCC climate change evaluation. This has opened the document up to sniping, both in an indirect (and CYA manner) and more directly (see the comment by Vincent Gray.

This raises the issue about what the IPCC should do.

The first is that the IPCC should refuse to respond to comments by anyone who has publicly broken their agreement to keep the draft confidential.

The second is that the IPCC should inform the US government that they have seriously damaged the process.

While it would be very difficult to implement, the IPCC should take over distribution of all future drafts in the US and not leave this to US government agencies.

RTFR (and the dictionary and the thesaurus, and don't forget Bartletts)


E has been out and a commenting in various places. Unfortunately he is not very impressed by the moral behavior of many posters. Being an old bunny, E is well aware that folk will utter absolute nonsense with perfectly straight faces, but he is shocked, I say shocked to have discovered that this behavior is common among the purveyors of Potemkin science (see the end of that post).

It is hard to know where to begin. Well we can start with two little libertarians at Deltoid. In defense of his pathological hatred of government Nanny Government Sucks used this quote:

"Government is not reason, it is not eloquence - it is force. Like fire, it is a dangerous servant and a fearsome master" - George Washington
and if you google that little beauty you get about 46,000 hits, which shows that those of the libertarian persuasion at least know how to use the copy and paste function of their computers. One problem. No one can find the original source. George never said it

In the same thread, Jack Strocchi chimes in with another golden oldie
"Thomas "government is best which governs least" Jefferson
This one, it appears was originally adopted (there appears to be an earlier source) by Henry Thoreau who attributed it to Jefferson, but TJ never said or wrote it.

We now move on to E's favorite pinata, RPJr. himself. RPJr is a smart cookie. Although I would bet significant money that he has access to the second draft of the IPCC report on climate change (AR4), he knows that he cannot quote directly from it without exposing himself to significant censure. Therefore he used a quote from a Yahoo Asia report to launch the first of many attacks on the document. Roger has the Steve Colbert's to write:
A second key difference is the substitution of the phase "dominant cause" for the word "most." IPCC terms are not chosen arbitrarily and my reading of this is that as far as GHGs, it represents a step back from the statement in 2001. I equate "most" with a majority (>50%) and "dominant" with a plurality. I am sure commentators will have a field day with that. Were I a betting person I'd wager that "dominant" won't last until the end.
As Eli pointed out there is only one problem with this. The definition of dominant.


dom·i·nant http://www.m-w.com/
Function: adjective
1 : commanding, controlling, or prevailing over all others
2 : overlooking and commanding from a superior position
3 : of, relating to, or exerting ecological or genetic dominance
4 : being the one of a pair of bodily structures that is the more effective or predominant in action
synonyms DOMINANT, PREDOMINANT, PARAMOUNT, PREPONDERANT mean superior to all others in influence or importance. DOMINANT applies to something that is uppermost because ruling or controlling .


And, just for fun, how about most


1 : greatest in quantity, extent, or degree
2 : the majority of
Let us be plain, Roger sucked in some pretty sharp characters with his little newspeak dictionary work. Andrew Dressler wrote

As far as "dominant" goes, I agree that this is not clear. I hope that they substitute this with a more transparent word when the final version comes out.
And after it was pointed out that dominant was totally clear and transparent to anyone with a dictionary and without an agenda he was not able to accept the idea that his friend Roger purposely mislead him
I think that what the writers intended for "dominant" was the meaning of "vast majority". But I agree w/ Roger that "dominant" is a poor word.
Eli had to hammer the point home
Andrew, what problem do you have accepting that if someone says dominant with respect to the influence of greenhouse gases they mean a commanding and controlling forcing prevailing over all others? They certainly do NOT MEAN MOST.
Unfortunately this caused Andrew to say
I have the document and the quote above is correct. I do not have a problem with "dominant" if that's what they mean. My point was that since this is a draft, I wonder if they really mean that. We'll see when the final version comes out.
Which, at least technically is a violation of the conditions he accepted for viewing the AR4 draft and I am sorry that he felt compelled to do that. Roger, of course, having set the trap, did not step into it. You do have to pass the definitions part of the SAT to be a professor at Colorado?

And finally in the analogy section of the test we have Ian Castles, who used this beaut:

I've seen a lot of consensuses evaporate in my time, but let's take an example from climate change science. In October 1987, Richard Morgenstern of the US EPA spoke on 'Implications of climate change for environmental policy making' at the conference 'Preparing for Climate Change' which was sponsored by the World Resource Institute, UNEP, the US National Science Foundation and 12 other US-based organisations.
He said that there was 'an emerging concensus that the global warming could result in a rise in sea level on the order of two to seven feet by 2100', and cited multi-authored books that had appeared in 1983, 1985 and 1987.
The 'two to seven feet' translates into 61-213 cm. Thirteen years later the IPCC concensus for the sea level rise between 1990 and 2100 was 9-88 cm - a decrease of 85% at the top of the range and nearly 60% at the bottom. Doesn't this mean that Paltridge may have a point when he says that 'Consensus on its own is not the sort of thing on which sensible people put their money?
The only problem being that he is comparing a 20 year old conference report by one person, expressing his seat of the pants impression of emerging science, representing at most one agency and one government, to a published report resulting from a structured consultative process involving international panels of experts.

And you know, people fell right into the hole that Ian Castles dug for them.

Wednesday, May 03, 2006

The cost of astroturf.....

If you are the Alexis de Toqueville Institution, it's for sale at $20K a pop and they will throw in an new front organization for free....

February 29, 1994
To: William P. Orzechowski
Tobacco Institute
Re: ETS Study
From: Cesar V. Conda

Per your memo, what follows is a proposed action plan by the Alexis de Tocqueville Institution on the ETS issue
ETS is environmental tobacco smoke aka second hand smoke
1. Produce a research paper to assess the research and scientific methods used in the original ETS studies -- and EPA's most recent cost-benefit "analysis" of the impact of ETS. Possible authors include - Fred Singer, Kent Jeffreys (formerly djrector of the Competitive Enterprise Institute's Environmental Studies Program). or another reputable economist (perhaps Bob Tollison).

2. Assemble an advisory board of economists and scientists who could endorse the findings in the report (perhaps call it the Commission on Environmental Science -- we envision that this would be used as framework to examine a variety of environmental science questions -- from endangered species to pesticides reform).

3. AdTI would release and distribute the report to press outlets nationwide and circulate widely on Capitol Hill.

The timetable for producing such a report will depend on the level of research that you believe is necessary. A baekgrounder length report by policy analysts like a Kent Jeffreys or Fred Singer would probably take 2-3 weeks; an original research paper by an academician could take several months.

My sense is that we could produce an efffective backgrounder report which reviews all of the known facts about the science used in the ETS ease. Moreover, the Commission on Environmental Science -- or whatever we choose to call it -- would give the issue added attention and prominence.

The cost of this project would be $20,000 which includes all costs (contracting, distribution, staff time, etc.)

As you know, we can move on this very quickly.
One stop shopping.


Saturday, April 29, 2006

Effective tobacco advertising....


A rather curious idea is being put forward by Roger Pielke Jr., that

In the battle over smoking efforts to deny a link between smoking and health risks seems to have been completely a lost effort.
This is consistent with Pielke's effort to frame other issues
...science has a huge role in getting a subject onto the "agenda" of decision making, but after that, its role is very much diminished and subsumed to other factors, such as cultural, social, and political. If this is correct, it would require some deeper understanding about the role of advocacy related to scientific issues and the efficacy of using science as a tool of advocacy.
and he continues
This begs the question -- why has anti-smoking advocacy been so successful over time? The throwaway answer that increasing scientific certainly is the key does not seem to jibe with this data.
The problem with this whole line of reasoning is that it is built upon a falsehood. The tobacco industry has used advertising, public relations campaigns, Potemkin science, litigation, and any other method it could find to maintain revenues. Deaths were collateral damage. This is no secret to anyone who reads the newspapers let alone science journals. The mortality data and the data on tobacco use and its relationship to advertising both pro and con is readily available to anyone who makes the smallest effort to search. The Potemkin science ** allowed all of the other efforts to go forward, providing a screen against the imperative necessity of eliminating tobacco that were being uncovered by medical research.

The Surgeon General has been reporting on tobacco use for over thirty years. You can find the reports here, and other information here. In the preface to the 2000 report, the Director of the Center for Disease Control, Jeffrey Koplan writes:
But if the evidence is clear that tobacco use is harmful and if the tools are available to reduce its use, why has the reduction in prevalence been less than would be expected? The answer is very complex. As described in Chapter 1 of this report, numerous forces influence a person’s decision to smoke, or if that person is a smoker, the forces that drive continued use. The most important force for smoking is the totality of industry activity, including advertising, promotion, organizational activity, support for ancillary issues, and political action, which maintains marketability and profitability of the product. Efforts to reduce tobacco use face a more than $5 billion annual budget that the tobacco industry dedicates to advertising and promotion aimed at sustaining or increasing tobacco use. Nonetheless, there is cause for optimism based on considerable public support for efforts to prevent children from becoming addicted to tobacco. If the recent pattern of increases in youth tobacco use can be reversed, we can make progress toward tobacco-free generations in the future.
What exactly have been the effects of advertising. In the introduction to the report, we read
Regulatory Efforts (Chapter 5)
Advertising and Promotion

Attempts to regulate advertising and promotion of tobacco products were initiated in the United States almost immediately after the appearance of the 1964 report to the Surgeon General on the health consequences of smoking. Underlying these attempts is the hypothesis that advertising and promotion recruit new smokers and retain current ones, thereby perpetuating a great risk to public health. The tobacco industry asserts that the purpose of marketing is to maintain brand loyalty. Considerable evidence has accumulated showing that advertising and promotion are perhaps the main motivators for adopting and maintaining tobacco use. Attempts to regulate tobacco marketing continue to take place in a markedly adversarial and litigious atmosphere. The initial regulatory action, promulgated in 1965, provided for a general health warning on cigarette packages but effectively preempted any further federal, state, or local requirements for health messages. In 1969, a successful court action invoked the Fairness Doctrine (not previously applied to advertising) to require broadcast media to air anti-tobacco advertising to counter the paid tobacco advertising then running on television and radio. Indirect evidence suggests that such counter-advertising had considerable impact on the public’s perception of smoking. Not surprisingly, the tobacco industry supported new legislation (adopted in 1971) prohibiting the advertising of tobacco products on broadcast media, because such legislation also removed the no-cost broadcasting of anti-tobacco advertising. A decade later, a Federal Trade Commission (FTC) staff report asserted that the dominant themes of remaining (non-broadcast) cigarette advertising associated smoking with “youthful vigor, good health, good looks and personal, social and professional acceptance and success” (Myers et al. 1981, p. 2-13). A nonpublic version of the report detailed some of the alleged marketing strategy employed by the industry; the industry denied the allegation that the source material for the report represented industry policy. Nonetheless, some of these concerns led to the enactment of the Comprehensive Smoking Education Act of 1984 (Public Law 98-474), which required a set of four rotating warnings on cigarette packages. The law did not, however, adopt other FTC recommendations that product packages should bear information about associated risks of addiction and miscarriage, as well as information on toxic components of cigarettes. In fact, many FTC-recommended requirements for packaging information that have been enacted in other industrialized nations have not been enacted in the United States.

The role of advertising is perhaps best epitomized by R.J. Reynolds Tobacco Company’s Camel brand campaign (initiated in 1988) using the cartoon character “Joe Camel.” Considerable research has demonstrated the appeal of this character to young people and the influence that the advertising campaign has had on minors’ understanding of tobacco use and on their decision to smoke. In 1997, the FTC brought a complaint asserting that by inducing minors to smoke, R.J. Reynolds’ advertising practices violated the Federal Trade Commission Act Public Law 96-252). The tobacco company subsequently agreed to cease using the Joe Camel campaign. Although the FTC’s act grants no private right of enforcement, a private lawsuit in California resulted in a settlement whereby the tobacco company agreed to cease its Joe Camel campaign; notably, the Supreme Court of California rejected R.J. Reynolds’ argument that the Comprehensive Smoking Education Act of 1984 preempted the suit’s attempt to further regulate tobacco advertising.
Among other tactics, the tobacco companies targeted marketing at women. The summaryof the Surgeon General's 2000 report on Smoking and Women includes:
In the 1990s, the decline in smoking rates among adult women stalled and, at the same time, rates were rising steeply among teenage girls, blunting earlier progress. Smoking rates among women with less than a high school education are three times higher than for college graduates. Nearly all women who smoke started as teenagers - and 30 percent of high school senior girls are still current smokers....

...Tobacco industry marketing is a factor influencing susceptibility to and initiation of smoking among girls, in the United States and overseas. Myriad examples of tobacco ads and promotions targeted to women indicate that such marketing is dominated by themes of social desirability and independence. These themes are conveyed through ads featuring slim, attractive, athletic models, images very much at odds with the serious health consequences experienced by so many women who smoke.

....Women have been extensively targeted in tobacco marketing, and tobacco companies have produced brands specifically for women, both in the United States and overseas. Myriad examples of tobacco ads and promotions targeted to women indicated that such marketing is dominated by themes of both social desirability and independence, which are conveyed through ads featuring slim, attractive, athletic models. Between 1995 and 1998, expenditures for domestic cigarette advertising and promotion increased from $4.90 billion to $6.73 billion. Tobacco industry marketing, including product design, advertising, and promotional activities, is a factor influencing susceptibility to and initiation of smoking.
** Something that appears elaborate and impressive but in actual fact lacks substance: “the Potemkin village of this country's borrowed prosperity” (Lewis H. Lapham). After Grigori Aleksandrovich Potemkin, who had elaborate fake villages constructed for Catherine the Great's tours of the Ukraine and the Crimea (from the American Heritage Dictionary)

Tobacco mortality ........


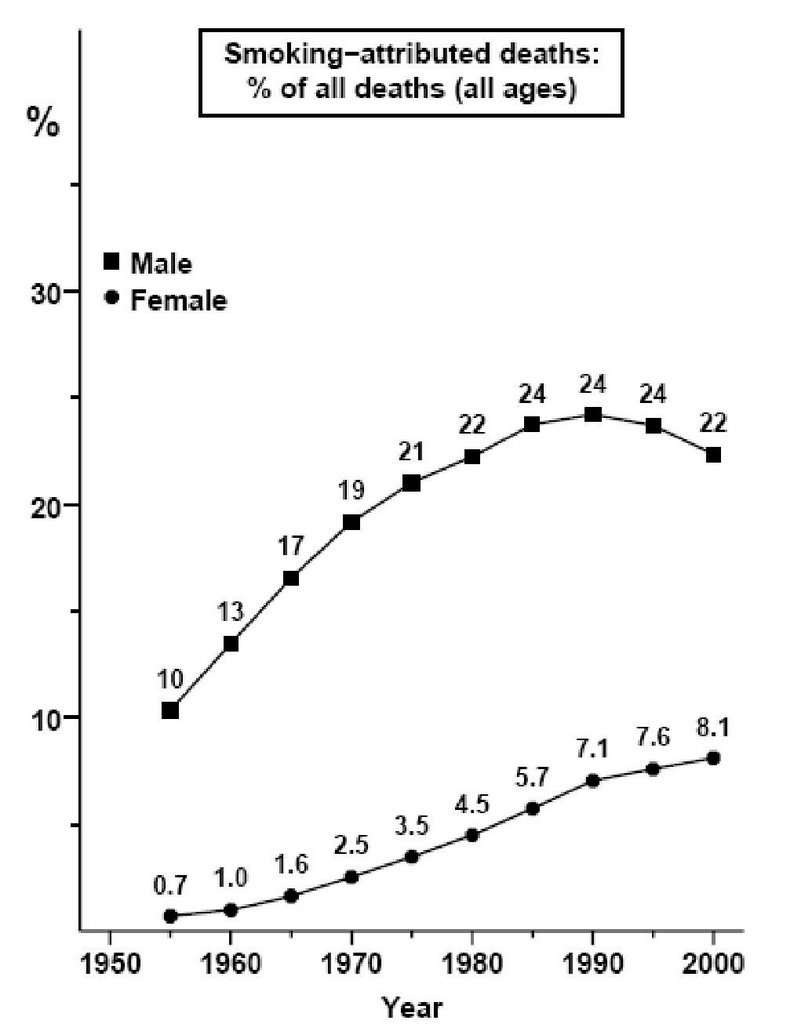
One of the purposes of this blog is to provide a place where I can store answers to questions that continually arise. Uncle E is becoming involved in the tobacco wars. Two issues have come up recently, the first having to do with mortality rates. The long and short of it is that mortality from smoking is large, accounting for ~20% of male and 10% of female deaths in developed countries. The situation in developing countries is not as well defined because the data is not of the same standard.

A motherload of data can be found at the Oxford Clinical Trial Service Unit site. Richard Peto and his colleagues have been keeping track of tobacco related mortality in developed countries. The seriousness of the situation can be seen in the graphic to the left. For those of you who are chauvinistic, the data from individual countries is available.

Below you will find a couple of abstracts that back up and expand on the information in the graphic. The take home message is that in 2000, 22% of all male deaths and 8.1% of female deaths in developed countries were tobacco related.

Those interested in looking further into this issue are referred to the Oxford CTSU site and to PubMed where you can search on "mortality from tobacco"

From PubMed:

Br Med Bull. 1996 Jan;52(1):12-21.
Mortality from smoking worldwide.

Peto R, Lopez AD, Boreham J, Thun M, Heath C Jr, Doll R.
ICRF/MRC/BHF Clinical Trial Service Unit, Radcliffe Infirmary, Oxford, UK.

Estimates are made of the numbers and proportions of deaths attributable to smoking in 44 developed countries in 1990. In developed countries as a whole, tobacco was responsible for 24% of all male deaths and 7% of all female deaths, rising to over 40% in men in some former socialist economies and 17% in women in the USA. The average loss of life for all cigarette smokers was about 8 years and for those whose deaths were attributable to tobacco about 16 years. Trends in mortality attributable to tobacco differed between countries. In some the mortality in middle age (35-69 years) had decreased by half in men since 1965; in others it was continuing to increase. In women, the proportion was mostly increasing, almost universally in old age. Mortality not attributable to smoking decreased since 1955 in all OECD (Organization for European Collaboration and Development) countries, by up to 60% in men and more in women. No precise estimate can be made of the number of deaths attributable to smoking in undeveloped countries, but the prevalence of smoking suggests that it will be large. In the world as a whole, some 3 million deaths a year are estimated to be attributable to smoking, rising to 10 million a year in 30-40 years' time.
Lancet. 1992 May 23;339(8804):1268-78.
Mortality from tobacco in developed countries: indirect estimation from national vital statistics.
Peto R., Lopez AD, Boreham J, Thun M, Heath C Jr.
Imperial Cancer Research Fund Cancer Studies Unit, University of Oxford, Radcliffe Infirmary, UK.

Prolonged cigarette smoking causes even more deaths from other diseases than from lung cancer. In developed countries, the absolute age-sex-specific lung cancer rates can be used to indicate the approximate proportions due to tobacco of deaths not only from lung cancer itself but also, indirectly, from vascular disease and from various other categories of disease. Even in the absence of direct information on smoking histories, therefore, national mortality from tobacco can be estimated approximately just from the disease mortality statistics that are available from all major developed countries for about 1985 (and for 1975 and so, by extrapolation, for 1995). The relation between the absolute excess of lung cancer and the proportional excess of other diseases can only be approximate, and so as not to overestimate the effects of tobacco it has been taken to be only half that suggested by a recent large prospective study of smoking and death among one million Americans. Application of such methods indicates that, in developed countries alone, annual deaths from smoking number about 0.9 million in 1965, 1.3 million in 1975, 1.7 million in 1985, and 2.1 million in 1995 (and hence about 21 million in the decade 1990-99: 5-6 million European Community, 5-6 million USA, 5 million former USSR, 3 million Eastern and other Europe, and 2 million elsewhere, [ie, Australia, Canada, Japan, and New Zealand]). More than half these deaths will be at 35-69 years of age: during the 1990s tobacco will in developed countries cause about 30% of all deaths at 35-69 (making it the largest single cause of premature death) plus about 14% of all at older ages. Those killed at older ages are on average already almost 80 years old, however, and might have died soon anyway, but those killed by tobacco at 35-69 lose an average of about 23 years of life. At present just under 20% of all deaths in developed countries are attributed to tobacco, but this percentage is still rising, suggesting that on current smoking patterns just over 20% of those now living in developed countries will eventually be killed by tobacco (ie, about a quarter of a billion, out of a current total population of just under one and a quarter billion).

Sunday, April 16, 2006

Fred Seitz is not as pure as the driven snow....


Since people keep referring to Fred Seitz as the scientist he was rather than the propagandist he has been for the past twenty or more years, it is worthwhile to bring together several comments on this matter that E has made so that he can simply point to a URL in response.

In another universe, Dr. E was challenged to show that Fred Seitz was not as pure as the driven snow. Seitz, of course, was an eminent condensed matter physicist, President of the National Academy of Sciences and President of Rockefeller University. In the later role he developed, shall we say, a close relationship with the tobacco industry, that somehow, later morphed into a close relationship with the fossil fuel industry. Both were remunerative, both personally and for organizations Seitz was associated with.

There are good sources you can use to show the octopus like reach that Seitz has had on both issues, for example, the disinfopedia, the tobacco document archive, and the Exxon Secrets site and, for those who like their meat red, an ecosyn blog.

Seitz has a very long association with the tobacco companies and their attempts to deny the harm that tobacco does and, of course, this gem which brings the singing Freds, Seitz and Singer, together. Singer is tied back to back with Seitz in a whole bunch of tricky business including the OISM petition (17000 duped dentists deny global warming) and the Heidelberg appeal which was a neat straddle between climate, tobacco and asbestos denialism. I am working on some comments about those after dinner entertainments.

By going through the tobacco documents archive, I was able to piece together a rather damning sequence of documents which shows exactly what Seitz has been about.

Seitz signs on:

May 1979
Pg 1
There are abundant reasons for R-J-R to place a priority on research, particularly on smoking and health research. One is that our sense of integrity dictates that we respond directly to a fundamental attack on our business. Another is that if we can refute the criticisms against cigarettes, we may remove government's excuse for imposing heavy taxes on the product. …… A third reason is that there are a large number of crucial questions that need scientific answers in the area of smoking and health.

Pg 7
In evaluating and monitoring the special projects that we fund -- particularly the sole-sponsorship programs -- R.J. Reynolds Industries has secured the services of a permanent consultant -- Dr. Frederick Seitz, former president of Rockefeller

Seitz’ role

June 1980
Procedures for Managing and Progress Monitoring of R.J. Reynolds .Industries Support of Biomedical Research .Management -
The following procedures govern the commitment of funds to biomedical research and the role of various individuals and authorities in considering requests and granting approvals:

Requests for funding support will be referred to Dr. Frederick Seitz

Dr. Seitz and other members of his advisory panel will review fund requests and prepare recommendations based on these criteria: Project viability, Researcher' s qualifications,

Adequacy of facilities, Consistency with overall program objective

Prior to presentation to the Contributions Committee-for disposition, Dr. Seitz will informally discuss recommendations with Mr. H.C. Romer, general counsel. His comments will be appended to the written evaluations and recommendations presented to the Contributions Committee

How much did Seitz get:
July 1986

Dear Dr. Seitz: We should like to renew the letter agreement dated July 12, 1978 between you and RJR Nabisco, Inc. (formerly R.J. Reynolds Industries, Inc.) for six months commencing July I, 1986 at an annual fee of $65,000 which shall be paid in equal monthly installments on the last day of each month. In all other respects the agreement will remain in full force and effect.

And just a pointer to the most amusing document in the entire tobacco archive.

Saturday, April 15, 2006

Tim Curtin insists on topping himself.....

Not only does he start by blowing two orders of magnitude in his favor....

Industrial production of CO2 at 100 million tonnes in 2005 growing at 10% pa (your figure) will overtake fossil fuel emissions of 25 billion tonnes of CO2 growing at net 0.005% pa (the actual rate of growth of CO2 at Mt Louai in Hawaii) by 2067.fossil fuel emissions of 25 billion tonnes of CO2 growing at net 0.005% pa (the actual rate of growth of CO2 at Mt Louai in Hawaii) by 2067
Only to catch himself half an hour later
Re Eli again, a correction, I mistyped the CO2 growth rate at the Hawaii station, it is 0.5% p.a. ( which is what I used in my extrapolation). Apologies.
But he can't figure out how to spell Mauna Loa (nice picture here).

He can't figure out that when the hare of the day (Happy Easter to all) said:
Yes, if you have one buck to your name and your money grows by 10%, while Bill Gates' money grows by 5%, your money is growing faster than his. And at the end of the day you got $1.10, and he got several hundreds of million $ in extra interest.
The 10% rate of increase did not refer to the growth of CO2 production for industrial gases. That looks to be ~3% or so (at least in the US).

As Chris O'Neill pointed out on Deltoid II even the correction is a bit shifty
BTW, the atmospheric CO2 is growing at 2% of the atmosphere's anthropogenic CO2 per year. If you want to model atmospheric CO2 with an exponential growth curve, try to remember that it didn't start at zero as an exponential growth curve does.
But wait, there is more, on an absolute basis, the rate of increase is closer to 0.7% than 0.5% (2.6 ppm/381 ppm current) and if you look at it as a percentage of preindustrial (280 ppm), then it is close to 1%.

Ian Gould is starting to make the point that most of the CO2 used for industrial purposes, ends up, guess where, in the atmosphere......

However there is another important question to ASK Tim Curtin: Where did that 100 million ton figure from, and in what sense it is using production. A lot of CO2 is produced in various industrial processes (brewing beer being my favorite) but very little of it is captured for industrial purposes.

Stephen Berg ASKS an important question:
Why are we squabbling over such a minor detail when there is a lot of work to be done to save our planet from ecological catastrophe?
To which the obvious answer is that when folk like Tim Curtin start throwing sand in the air, you need to show their propaganda up for what it is so that folk like Stephen Berg will see them for what they are, and what they are is not making any kind of contribution to an honest discussion.

Off to deliver......

Friday, April 14, 2006

More spag thrown on the wall....


We have a new winner for the most meaningless statement of the week on climate change. This, courtesy of Tim Curtin on Deltoid.

Neither is aware that the demand for industrial CO2 is growing faster than the production by AGW.
First of all, AGW (anthropic global warming) is a RESULT of increased human emissions of CO2, although there is some positive feedback as temperatures rise, increasing the rate of vegetative decay, and shifting of the CO2/H2CO3/HCO3-/CO3 2- equilibria in the oceans.

Second, comparing rates, when the magnitude of the two processes differs by several powers of 10 is more than a shade dishonest. Yes, if you have one buck to your name and your money grows by 10%, while Bill Gates' money grows by 5%, your money is growing faster than his. And at the end of the day you got $1.10, and he got several hundreds of million $ in extra interest.

Thursday, April 13, 2006

RTFR (I)


UPDATE: For those coming in from various places we have posted an update on 1988 and all that for those who want to look behind the thick black RSS line, and there is a whole series of Rabett Run posts, perhaps the most relevant of which is No More Mr. Nice Bunny where Jim Hansen shows the rubes the trick (esp. if you are reading Climate Audit). Well Lookee That and Business as Usual in 1988 are also worth a look. You can find more of these by searching this blog on "1988"

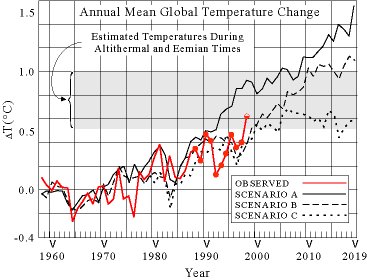
A rather strange push back has developed centering around Jim Hansen's Congressional testimony in 1988. In that testimony he presented a graph with three scenarios which he labeled A, B, C, and predictions of global temperature based on each of these scenarios


In 1998, Patrick Michaels in testimony before congress, also presented this graph, but erased scenarios B and C. He claimed that,

That model predicted that global temperature between 1988 and 1997 would rise by 0.45°C (Figure 1). Figure 2 compares this to the observed temperature changes from three independent sources. Ground-based temperatures from the IPCC show a rise of 0.11°C, or more than four times less than Hansen predicted. Lower atmosphere temperatures measured by ascending thermistors on weather balloons show a decline of 0.36°C and satellites measuring the same layer (our only truly global measure) showed a decline of 0.24°C.
The statements about satellite and weather balloon measurements have now been shown to "inoperative" (e.g. wrong, they are now are calculated to be consistent with surface measurements )**. Hansen was a mite peeved at Pat's erasing. He has put his take on this and other acts of denial on the GISS site.

However, a bunch of very strange spaghetti is being thrown against the wall with respect to Hansen's 1988 testimony and the paper upon which the testimony was based (J. Geophys. Res. 93 (8) 9341-9364 (1988). Some of them are very simple to deal with, others are more complex. Finally, I do want to check in the Library of Congress to see if the written and oral testimony is available.

Eli was able to find the abstract for this paper at GISS, and posted it into the maelstrom at R Pielke's place (towards the bottom) where he has become an unfavorite for pointing out that the Emperor is wearing some interesting togs. One of the weird claims was that Hansen had never said that Scenario B was the most probable in his testimony or in the abstract. This was a VERY serious issue for Paul, just Paul. To which we say RTFR (p9345 2nd paragraph)
These scenarios are designed to yield sensitivity experiments for a broad range of future greenhouse forcings. Scenario A, since it is exponential, must eventually be on the high side of reality in view of finite resource constraints and environmental concerns, even though the growth of emissions in scenario A (~1.5%/yr) is less than the rate typical of the past century (~4%/yr). Scenario C is a more drastic curtailment of emissions than has generally been imagined; it represents elimination of cholorfluorocarbon emissions by 2000 and reduction of CO2 and other trace gas emissions to a level such that the annual growth rates are zero (i.e. the sources just balance the sinks) by the year 2000. Scenario B is perhaps the most plausible of the three cases.
2. But wait, there is even more amusement in the comments, one of the Ethonettes, Jim Clarke (in reference to the very warm El Nino year 1998, where the global temperature was so high that we are just reaching it again ) said:
I would also like to point out that you will not find a 7 year period of 'flat' temperatures in any of Hansen's forecasts with increasing CO2. Even with ENSO cycles, his graphs show a net warming over any seven year period.
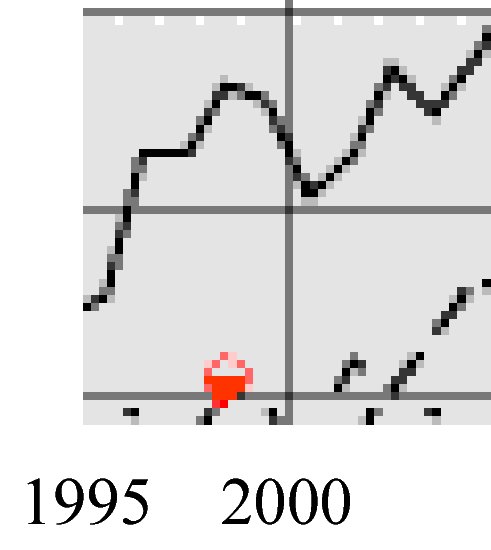
Actually you can, the period between 1974 and 1982 in Scenarios B and C. But there is a VERY interesting little wrinkle in Scenario A. I've taken the liberty of isolating Scenario A between about 1995 and 2005

[insert tongue in cheek] As you can see, the GISS model found the 1998 Super El Nino, ten years before it occurred, and as you can see, in this exponential forcing model it took five years for the temperature to exceed the global temperature in the Super El Nino year. Another triumph for GCMs!


**an important point to remember is that the satellite does not measure temperature directly, but microwave emission from the atmosphere and this must be converted to temperature by a rather involved calculation).